## Table: Latency Breakdown by Operation
### Overview
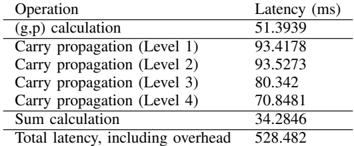
The image presents a structured table detailing the latency (in milliseconds) associated with various computational operations. The table includes six rows, each representing a distinct operation, and two columns: "Operation" and "Latency (ms)". The values are precise, with varying decimal precision, and the final row aggregates the total latency, including overhead.
### Components/Axes
- **Columns**:
1. **Operation**: Describes the computational task (e.g., "(g,p) calculation", "Carry propagation (Level 1)").
2. **Latency (ms)**: Numerical values representing the time taken for each operation, measured in milliseconds.
- **Rows**:
1. **(g,p) calculation**: 51.3939 ms
2. **Carry propagation (Level 1)**: 93.4178 ms
3. **Carry propagation (Level 2)**: 93.5273 ms
4. **Carry propagation (Level 3)**: 80.342 ms
5. **Carry propagation (Level 4)**: 70.8481 ms
6. **Sum calculation**: 34.2846 ms
7. **Total latency, including overhead**: 528.482 ms
### Detailed Analysis
- **Latency Values**:
- The **(g,p) calculation** has the second-highest latency at **51.3939 ms** (four decimal places).
- **Carry propagation** latencies decrease progressively from **Level 1 (93.4178 ms)** to **Level 4 (70.8481 ms)**.
- **Sum calculation** has the lowest latency at **34.2846 ms** (four decimal places).
- **Total latency** aggregates all operations and overhead, totaling **528.482 ms**.
- **Decimal Precision**:
- **(g,p) calculation** and **sum calculation** use four decimal places, while others use two. This may reflect differing measurement granularity or reporting standards.
### Key Observations
1. **Carry Propagation Trends**:
- Latency decreases by ~13 ms from Level 1 to Level 4, suggesting optimization or reduced complexity in higher levels.
2. **Overhead Contribution**:
- The total latency (528.482 ms) exceeds the sum of individual operations (423.8137 ms) by **104.6683 ms**, indicating significant overhead not explicitly listed in the table.
3. **Precision Variability**:
- Inconsistent decimal precision across operations may imply varying measurement tools or reporting conventions.
### Interpretation
- **Operational Impact**:
- **Carry propagation** dominates total latency, accounting for ~176 ms (33% of total). This suggests it is a critical bottleneck.
- **Overhead** constitutes ~20% of total latency, highlighting inefficiencies in system design or process management.
- **Design Implications**:
- Optimizing **carry propagation** (e.g., reducing Level 1 latency) could yield the most significant performance gains.
- The unexplained overhead warrants further investigation to identify hidden computational costs.
- **Data Reliability**:
- The mix of decimal precisions raises questions about measurement consistency. Standardizing reporting formats could improve data comparability.
This table underscores the importance of granular latency analysis in identifying performance bottlenecks and optimizing computational workflows.