\n
## Data Table: Operation Latency
### Overview
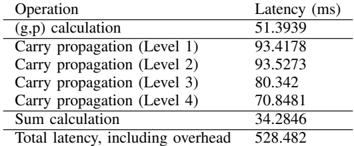
The image presents a data table detailing the latency (in milliseconds) of various operations involved in a calculation. The table lists individual operations and their corresponding latency values, culminating in a total latency figure.
### Components/Axes
The table has two columns:
* **Operation:** Describes the specific computational step.
* **Latency (ms):** Indicates the time taken for that operation, measured in milliseconds.
### Detailed Analysis or Content Details
The table contains the following data:
| Operation | Latency (ms) |
| -------------------------- | ------------ |
| (g,p) calculation | 51.3939 |
| Carry propagation (Level 1) | 93.4178 |
| Carry propagation (Level 2) | 93.5273 |
| Carry propagation (Level 3) | 80.342 |
| Carry propagation (Level 4) | 70.8481 |
| Sum calculation | 34.2846 |
| Total latency, including overhead | 528.482 |
### Key Observations
* Carry propagation operations contribute significantly to the overall latency, with values ranging from approximately 70ms to 93.5ms.
* The (g,p) calculation has a latency of approximately 51.4ms.
* The sum calculation is the fastest operation, with a latency of approximately 34.3ms.
* The total latency, including overhead, is 528.482ms.
### Interpretation
The data suggests that carry propagation is a performance bottleneck in this calculation. The multiple levels of carry propagation indicate a potentially complex arithmetic operation, likely involving large numbers or multiple additions. The total latency is dominated by the cumulative time spent in these carry propagation steps. Optimizing the carry propagation process could lead to significant performance improvements. The inclusion of "overhead" in the total latency suggests that there are additional factors contributing to the overall execution time beyond the listed operations. The (g,p) calculation and sum calculation are relatively fast compared to the carry propagation steps.