## Data Table: Operation Latency Breakdown
### Overview
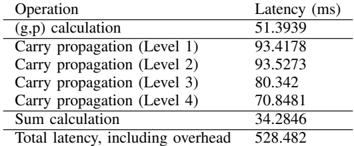
The image displays a two-column table presenting a breakdown of latency measurements (in milliseconds) for various computational operations, culminating in a total latency figure that includes overhead. The table appears to be from a technical performance analysis, likely related to a cryptographic or arithmetic circuit implementation.
### Components/Axes
* **Column 1 Header:** `Operation`
* **Column 2 Header:** `Latency (ms)`
* **Rows:** The table contains 7 data rows following the header row. Each row lists a specific operation and its associated latency value.
### Detailed Analysis
The table lists the following operations and their precise latency values:
| Operation | Latency (ms) |
| :--- | :--- |
| (g,p) calculation | 51.3939 |
| Carry propagation (Level 1) | 93.4178 |
| Carry propagation (Level 2) | 93.5273 |
| Carry propagation (Level 3) | 80.342 |
| Carry propagation (Level 4) | 70.8481 |
| Sum calculation | 34.2846 |
| **Total latency, including overhead** | **528.482** |
### Key Observations
1. **Highest Latency Components:** The "Carry propagation" operations at Level 1 and Level 2 are the most time-consuming individual steps, with latencies of approximately 93.42 ms and 93.53 ms, respectively.
2. **Latency Trend in Carry Propagation:** There is a clear decreasing trend in latency across the four levels of carry propagation, from ~93.4 ms at Level 1 down to ~70.8 ms at Level 4.
3. **Lowest Latency Component:** The "Sum calculation" is the fastest listed operation at approximately 34.28 ms.
4. **Total vs. Sum of Parts:** The sum of the six individual operation latencies is 423.8137 ms. The stated "Total latency, including overhead" is 528.482 ms. The difference (104.6683 ms) represents unlisted overhead costs associated with the overall process.
### Interpretation
This table provides a granular performance profile for a multi-stage computational process, most likely a multi-level carry-lookahead adder or a similar arithmetic unit used in high-performance computing or cryptography. The data suggests that the carry propagation logic, particularly at the initial levels, is the primary performance bottleneck. The decreasing latency across carry propagation levels could indicate a hierarchical or tree-based structure where operations become simpler or more parallelizable at higher levels. The significant overhead (nearly 20% of the total time) highlights the importance of system-level factors beyond the core arithmetic operations, such as memory access, control logic, or data movement. For a system designer, this breakdown indicates that optimizing the Level 1 and Level 2 carry propagation logic would yield the most significant performance improvements.