## Table: Latency Analysis
### Overview
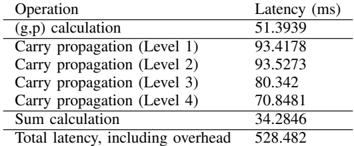
The table provides a breakdown of latency measurements for various operations in a computational system. The operations include (g,p) calculation, carry propagation at different levels, and sum calculation. The total latency, including overhead, is also included.
### Components/Axes
- **Operation**: The type of operation being measured.
- **Latency (ms)**: The time taken to complete the operation in milliseconds.
### Detailed Analysis or ### Content Details
| Operation | Latency (ms) |
|----------------------------|---------------|
| (g,p) calculation | 51.3939 |
| Carry propagation (Level 1)| 93.4178 |
| Carry propagation (Level 2)| 93.5273 |
| Carry propagation (Level 3)| 80.342 |
| Carry propagation (Level 4)| 70.8481 |
| Sum calculation | 34.2846 |
| **Total latency, including overhead** | **528.482** |
### Key Observations
- The (g,p) calculation has the lowest latency at 51.3939 ms.
- Carry propagation at Level 1 has the highest latency at 93.4178 ms.
- The latency decreases as the level of carry propagation increases.
- The sum calculation has the lowest latency at 34.2846 ms.
- The total latency, including overhead, is significantly higher than the sum calculation latency.
### Interpretation
The data suggests that the (g,p) calculation is the most efficient operation in terms of latency. The carry propagation operations have varying latencies, with the highest latency at Level 1. The sum calculation is the most efficient operation, with the lowest latency. The total latency, including overhead, is significantly higher than the sum calculation latency, indicating that overhead costs are a significant factor in the overall latency of the system.