## Line Chart: Mamba-2.8B: Block vs Mixer Output F1 Scores
### Overview
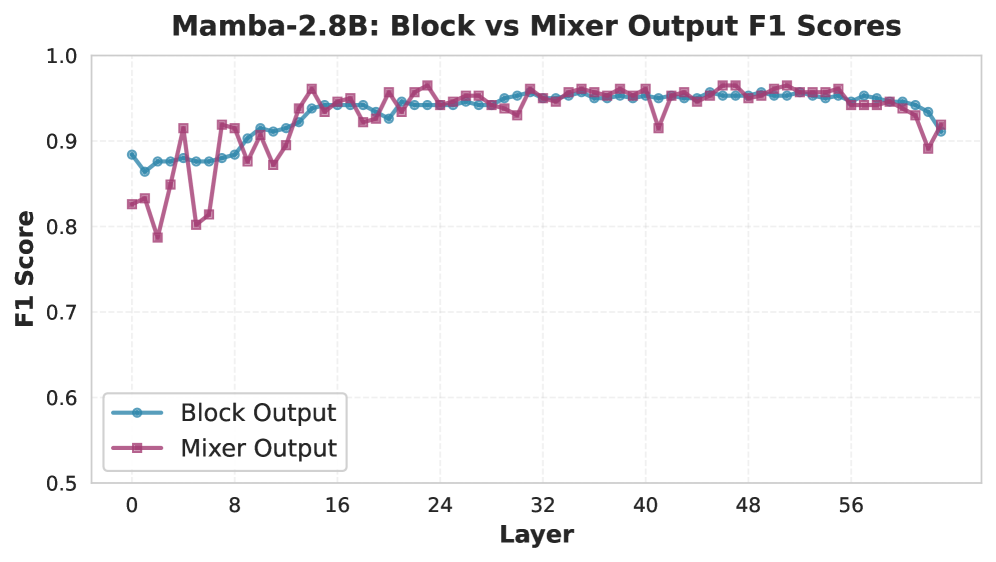
The image is a line chart comparing the F1 scores of "Block Output" and "Mixer Output" across different layers in the Mamba-2.8B model. The x-axis represents the layer number, and the y-axis represents the F1 score.
### Components/Axes
* **Title:** Mamba-2.8B: Block vs Mixer Output F1 Scores
* **X-axis:**
* Label: Layer
* Scale: 0 to 56, with increments of 8 (0, 8, 16, 24, 32, 40, 48, 56)
* **Y-axis:**
* Label: F1 Score
* Scale: 0.5 to 1.0, with increments of 0.1 (0.5, 0.6, 0.7, 0.8, 0.9, 1.0)
* **Legend:** Located in the bottom-left corner.
* Blue line with circle markers: Block Output
* Purple line with square markers: Mixer Output
### Detailed Analysis
* **Block Output (Blue Line):**
* Trend: Initially increases from layer 0 to approximately layer 16, then stabilizes with minor fluctuations around an F1 score of approximately 0.95, and decreases slightly towards the end.
* Data Points:
* Layer 0: ~0.88
* Layer 8: ~0.88
* Layer 16: ~0.94
* Layer 24: ~0.94
* Layer 32: ~0.95
* Layer 40: ~0.95
* Layer 48: ~0.95
* Layer 56: ~0.94
* **Mixer Output (Purple Line):**
* Trend: More volatile than Block Output in the initial layers (0-16), then converges towards the Block Output, stabilizing around an F1 score of approximately 0.95, and decreases slightly towards the end.
* Data Points:
* Layer 0: ~0.82
* Layer 8: ~0.81
* Layer 16: ~0.94
* Layer 24: ~0.95
* Layer 32: ~0.95
* Layer 40: ~0.95
* Layer 48: ~0.95
* Layer 56: ~0.93
### Key Observations
* The F1 scores for both Block Output and Mixer Output are relatively high, generally above 0.8.
* The Mixer Output shows more variation in the initial layers compared to the Block Output.
* Both outputs converge to similar F1 scores after approximately layer 16.
* Both outputs show a slight decrease in F1 score towards the end of the layers.
### Interpretation
The chart suggests that both the Block Output and Mixer Output of the Mamba-2.8B model perform well, as indicated by their high F1 scores. The Mixer Output's initial volatility might indicate a period of adjustment or learning in the earlier layers. The convergence of the two outputs after layer 16 suggests that they eventually reach a similar level of performance. The slight decrease in F1 score towards the end could be due to factors such as vanishing gradients or overfitting in the later layers of the model. Overall, the model demonstrates stable and high performance across different layers, with minor differences between the Block and Mixer outputs.