\n
## Line Chart: Mamba-2.8B: Block vs Mixer Output F1 Scores
### Overview
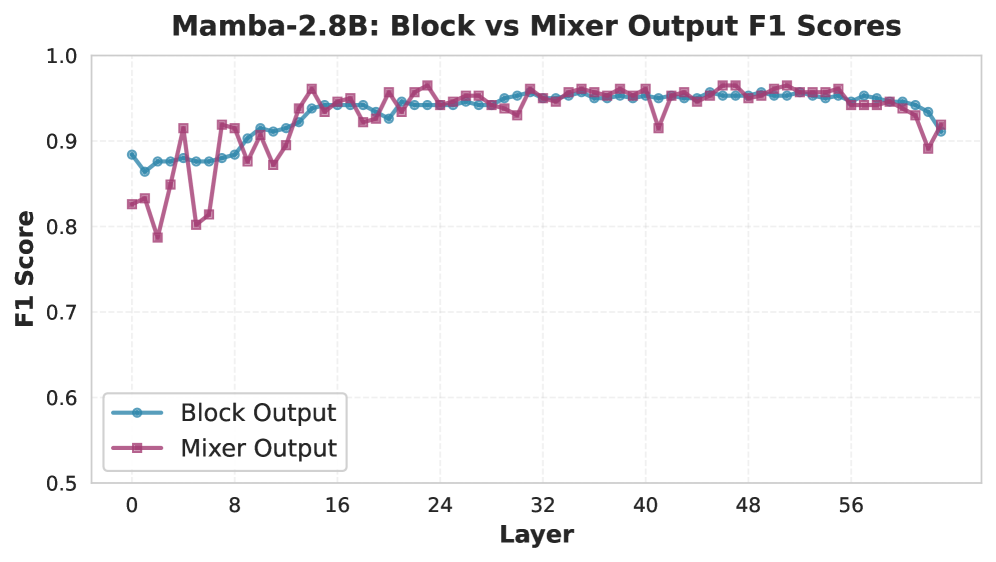
This line chart compares the F1 scores of "Block Output" and "Mixer Output" across different layers in a Mamba-2.8B model. The x-axis represents the layer number, and the y-axis represents the F1 score. The chart displays the performance of each output type as the model depth increases.
### Components/Axes
* **Title:** Mamba-2.8B: Block vs Mixer Output F1 Scores
* **X-axis Label:** Layer
* **Y-axis Label:** F1 Score
* **Y-axis Scale:** Ranges from approximately 0.5 to 1.0, with tick marks at 0.6, 0.7, 0.8, 0.9, and 1.0.
* **X-axis Scale:** Ranges from 0 to 56, with tick marks at intervals of 8.
* **Legend:** Located in the bottom-left corner.
* **Blue Line:** Block Output
* **Pink/Magenta Line:** Mixer Output
### Detailed Analysis
The chart shows two lines representing the F1 scores for Block Output and Mixer Output as a function of layer number.
**Block Output (Blue Line):**
The line starts at approximately 0.85 at layer 0, exhibits some initial fluctuations, then generally increases to a plateau around 0.95 between layers 16 and 48. After layer 48, the line begins a slight downward trend, ending at approximately 0.92 at layer 56.
* Layer 0: ~0.85
* Layer 8: ~0.89
* Layer 16: ~0.93
* Layer 24: ~0.94
* Layer 32: ~0.95
* Layer 40: ~0.95
* Layer 48: ~0.95
* Layer 56: ~0.92
**Mixer Output (Pink/Magenta Line):**
The line begins at approximately 0.82 at layer 0, shows more pronounced fluctuations than the Block Output line, reaching a peak around 0.96 at layer 24. It then fluctuates around 0.94-0.95 until layer 48, after which it declines to approximately 0.91 at layer 56.
* Layer 0: ~0.82
* Layer 8: ~0.88
* Layer 16: ~0.92
* Layer 24: ~0.96
* Layer 32: ~0.94
* Layer 40: ~0.95
* Layer 48: ~0.94
* Layer 56: ~0.91
### Key Observations
* Both Block Output and Mixer Output achieve high F1 scores (above 0.9) across most layers.
* Mixer Output exhibits greater variability in F1 scores compared to Block Output.
* Mixer Output initially starts with a lower F1 score than Block Output but reaches a higher peak around layer 24.
* Both lines show a slight decline in F1 score towards the final layers (around layer 56).
### Interpretation
The data suggests that both Block Output and Mixer Output perform well in the Mamba-2.8B model, achieving high F1 scores across most layers. The Mixer Output demonstrates more dynamic behavior, with larger fluctuations in performance. The initial lower performance of Mixer Output, followed by a peak, could indicate a period of adaptation or learning within the model. The slight decline in both outputs towards the end suggests potential saturation or diminishing returns as the model depth increases. The consistent high performance of Block Output suggests it is a more stable component within the model. The differences in the curves could be indicative of the strengths and weaknesses of each output type within the Mamba architecture. Further investigation would be needed to understand the reasons behind these differences and their impact on the overall model performance.