## Cumulative Citations Over Time
### Overview
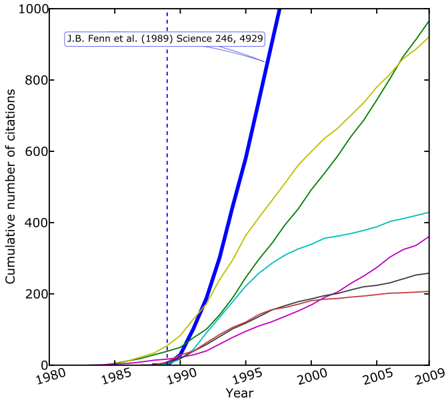
The image is a line chart showing the cumulative number of citations over time for several unspecified publications or research areas. The x-axis represents the year, ranging from 1980 to 2009. The y-axis represents the cumulative number of citations, ranging from 0 to 1000. There are multiple lines, each representing a different publication or research area, showing how citations accumulate over time. A vertical dashed line marks the year 1989, and a text box references "J.B. Fenn et al. (1989) Science 246, 4929".
### Components/Axes
* **X-axis:** Year, ranging from 1980 to 2009, with markers at 1980, 1985, 1990, 1995, 2000, 2005, and 2009.
* **Y-axis:** Cumulative number of citations, ranging from 0 to 1000, with markers at 0, 200, 400, 600, 800, and 1000.
* **Lines:** Multiple lines representing different publications or research areas. The colors are blue, yellow, green, cyan, purple, brown, and black.
* **Vertical Dashed Line:** A blue dashed line at the year 1989.
* **Text Box:** A text box in the top-left corner containing the text "J.B. Fenn et al. (1989) Science 246, 4929". An arrow points from the text box to the blue line.
### Detailed Analysis
* **Blue Line:** This line starts at approximately 0 citations in 1988 and increases linearly to approximately 900 citations by 1996. It then continues linearly to 1000 citations by 1997.
* **Yellow Line:** This line starts at approximately 0 citations in 1987 and increases to approximately 700 citations by 2009.
* **Green Line:** This line starts at approximately 0 citations in 1988 and increases to approximately 900 citations by 2009.
* **Cyan Line:** This line starts at approximately 0 citations in 1988 and increases to approximately 400 citations by 2009.
* **Purple Line:** This line starts at approximately 0 citations in 1988 and increases to approximately 250 citations by 2009.
* **Brown Line:** This line starts at approximately 0 citations in 1988 and increases to approximately 200 citations by 2009.
* **Black Line:** This line starts at approximately 0 citations in 1988 and increases to approximately 250 citations by 2009.
### Key Observations
* The blue line, associated with the "J.B. Fenn et al. (1989)" publication, shows the most rapid increase in citations in the early years.
* The other lines show a more gradual increase in citations over the entire period.
* All lines start accumulating citations around the late 1980s.
### Interpretation
The chart illustrates the cumulative impact of different publications or research areas over time, as measured by the number of citations they receive. The steep initial rise of the blue line suggests that the "J.B. Fenn et al. (1989)" publication had a significant and immediate impact on the field. The other lines represent publications or research areas that have had a more gradual and sustained impact. The vertical line at 1989 may indicate a significant event or publication that influenced the citation trends. The data suggests that the publication by J.B. Fenn et al. was a seminal work that rapidly gained recognition and influence.