\n
## Chart: Analog Switching Characteristics of a ReRAM Device & Experimental Array Metrics
### Overview
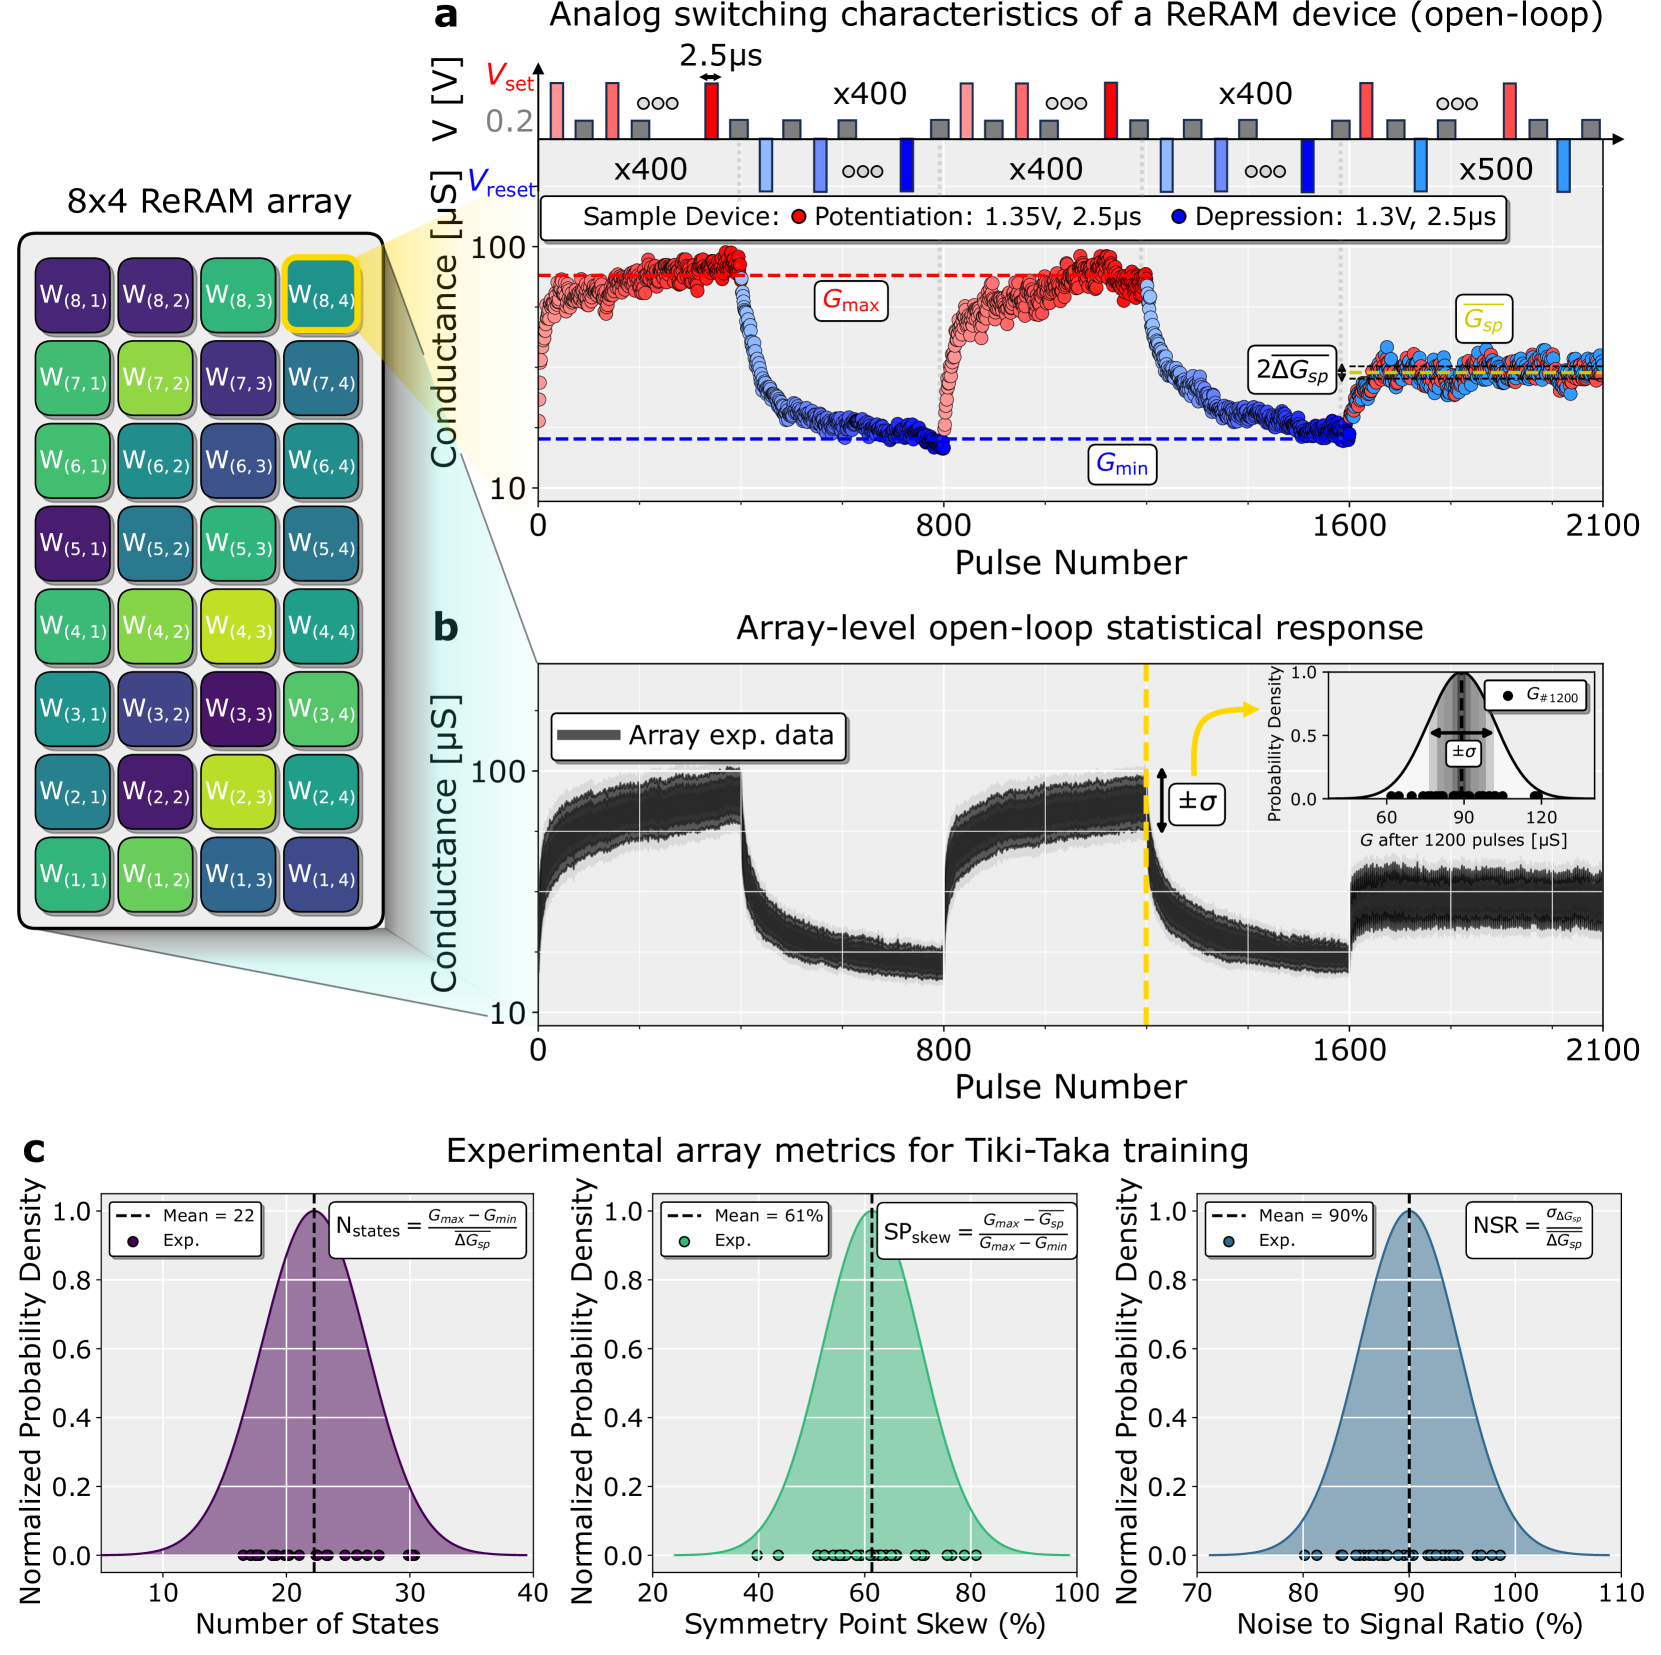
The image presents a series of charts illustrating the analog switching characteristics of a Resistive Random Access Memory (ReRAM) device, along with experimental array metrics for a "Tiki-Taka" training process. The charts explore conductance changes with pulse number, statistical response, and distributions of key parameters. The image is divided into three main sections: (a) a conductance vs. pulse number plot with inset voltage waveform, (b) an array-level open-loop statistical response plot with a probability distribution inset, and (c) three histograms showing distributions of number of states, symmetry, and noise.
### Components/Axes
**Section (a):**
* **Title:** Analog switching characteristics of a ReRAM device (open-loop)
* **X-axis:** Pulse Number (0 to 2100)
* **Y-axis:** Conductance (logarithmic scale, approximately 1 to 100 [µS])
* **Voltage Waveform (top):** Shows a series of pulses labeled 2.5µs, x400, x400, x500. The voltage is indicated as V<sub>set</sub>.
* **Annotations:** G<sub>max</sub>, G<sub>min</sub>, ΔG<sub>sp</sub>.
* **Sample Device:** Potentiation: 1.35V, 3.5µs; Depression: 1.3V, 2.5µs
**Section (b):**
* **Title:** Array-level open-loop statistical response
* **X-axis:** Pulse Number (0 to 2100)
* **Y-axis:** Conductance (logarithmic scale, approximately 1 to 100 [µS])
* **Inset:** Probability distribution of conductance after 1200 pulses (µS). Labeled with ±σ.
* **Annotation:** Array exp. data
**Section (c):**
* **Title:** Experimental array metrics for Tiki-Taka training
* **Histogram 1:**
* **X-axis:** Number of States (0 to 31)
* **Y-axis:** Normalized Probability Density (0 to 1.0)
* **Annotations:** Mean = 22, n<sub>states</sub>, Exp.
* **Histogram 2:**
* **X-axis:** Symmetry (0 to 1.0)
* **Y-axis:** Normalized Probability Density (0 to 1.0)
* **Annotations:** Mean = 61%, SP<sub>skew</sub> = σ<sub>max</sub>/ΔG<sub>0</sub>, Exp.
* **Histogram 3:**
* **X-axis:** Noise (0 to 1.0)
* **Y-axis:** Normalized Probability Density (0 to 1.0)
* **Annotations:** Mean = 90%, NSR = σ<sub>noise</sub>/ΔG<sub>0</sub>, Exp.
**Additional Element:**
* **8x4 ReRAM array:** A grid labeled W<sub>(i,j)</sub> where i ranges from 1 to 8 and j ranges from 1 to 4.
### Detailed Analysis or Content Details
**Section (a):**
The conductance vs. pulse number plot shows a fluctuating conductance value. The line starts at approximately 20 µS and fluctuates between approximately 20 µS and 80 µS for the first 800 pulses. After 800 pulses, the conductance generally decreases, reaching a minimum of approximately 10 µS around pulse number 1600. The conductance then increases again, reaching approximately 40 µS at pulse number 2100. G<sub>max</sub> is approximately 80 µS and G<sub>min</sub> is approximately 10 µS. ΔG<sub>sp</sub> is approximately 60 µS.
**Section (b):**
The array-level response shows a similar trend to (a), but with a wider spread of data points. The data points are clustered around a central line that decreases from approximately 60 µS to 20 µS between pulse numbers 0 and 1600, then increases slightly to approximately 30 µS at pulse number 2100. The inset shows a probability distribution centered around approximately 70 µS with a standard deviation of approximately 10 µS.
**Section (c):**
* **Histogram 1 (Number of States):** The distribution is centered around 22 states, with a peak probability density of approximately 0.25.
* **Histogram 2 (Symmetry):** The distribution is centered around 61% symmetry, with a peak probability density of approximately 0.3.
* **Histogram 3 (Noise):** The distribution is centered around 90% noise, with a peak probability density of approximately 0.4.
### Key Observations
* The conductance of the ReRAM device exhibits significant fluctuations with each pulse.
* The array-level response shows a wider distribution of conductance values compared to the single device response.
* The Tiki-Taka training process results in an average of 22 states, 61% symmetry, and 90% noise.
* The inset in (b) shows a relatively narrow distribution of conductance values after 1200 pulses, indicating some degree of convergence.
### Interpretation
The data suggests that the ReRAM device exhibits analog switching behavior, with conductance values that can be modulated by applying a series of pulses. The fluctuations in conductance may be due to stochastic effects or variations in the device characteristics. The array-level response shows that these fluctuations are amplified when multiple devices are connected in an array. The Tiki-Taka training process appears to be effective in achieving a reasonable number of states, but it also introduces a significant amount of noise. The symmetry metric indicates the balance between potentiation and depression during the training process. The high noise level may limit the precision of the analog storage. The inset in (b) suggests that the conductance distribution converges after a certain number of pulses, indicating that the device is approaching a stable state. The ReRAM array is labeled with W<sub>(i,j)</sub>, indicating a matrix of resistive elements, likely used for parallel processing or memory storage. The "Tiki-Taka" training likely refers to a specific algorithm or method used to tune the conductance levels of the ReRAM array for a particular application, potentially related to neural network training.