## Diagram: Frame 6 (first bounce)
### Overview
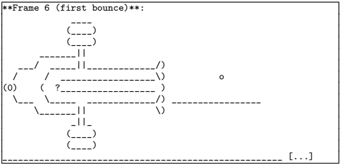
The image depicts a schematic diagram labeled "Frame 6 (first bounce)" at the top. It consists of a network of dashed lines, arrows, parentheses, and symbols arranged in a structured layout. The diagram includes textual annotations such as "(0)", "?", and "o", connected by directional arrows and grouped within parentheses.
### Components/Axes
- **Title**: "**Frame 6 (first bounce)**" (top-center).
- **Key Symbols**:
- Parentheses `()` enclosing nodes or states.
- Arrows `→` and `←` indicating directional flow.
- Dashed lines `--` connecting components.
- Symbols: `(0)`, `?`, and `o` (small circle).
- **Layout**:
- Central node: `(0)` with bidirectional arrows.
- Right-side node: `o` connected via dashed lines.
- Left-side node: `?` enclosed in parentheses, linked to other components.
- Bottom section: Additional parentheses and dashed lines, possibly representing sub-processes or loops.
### Detailed Analysis
- **Textual Elements**:
- `(0)`: Likely represents an initial state or node.
- `?`: Suggests a decision point or uncertainty.
- `o`: A terminal or intermediate state.
- **Connections**:
- Arrows between `(0)` and `?` indicate a bidirectional relationship.
- Dashed lines from `?` to `o` imply a conditional or probabilistic transition.
- Parentheses group nodes, possibly denoting sub-states or clusters.
### Key Observations
- The diagram emphasizes **flow control** with decision points (`?`) and state transitions.
- The use of parentheses and dashed lines suggests modularity or hierarchical relationships.
- No numerical data or scales are present; the focus is on logical or procedural relationships.
### Interpretation
This diagram likely represents a **state transition model** or **process flow** for a "first bounce" event. The central `(0)` node could denote an initial condition, while `?` acts as a decision gate determining the path to `o`. The absence of quantitative data implies the diagram prioritizes **logical structure** over measurable metrics. The bidirectional arrows between `(0)` and `?` suggest feedback loops or reversible steps, while the dashed lines to `o` may indicate probabilistic outcomes or secondary processes.
The diagram’s simplicity and reliance on symbolic notation align with technical schematics used in systems design, algorithm flowcharts, or event-driven architectures. The "first bounce" label hints at a specific phase in a larger sequence, possibly related to physics simulations, user interaction models, or iterative processes.