## Line Chart: Accuracy vs. Number of Generated Solutions
### Overview
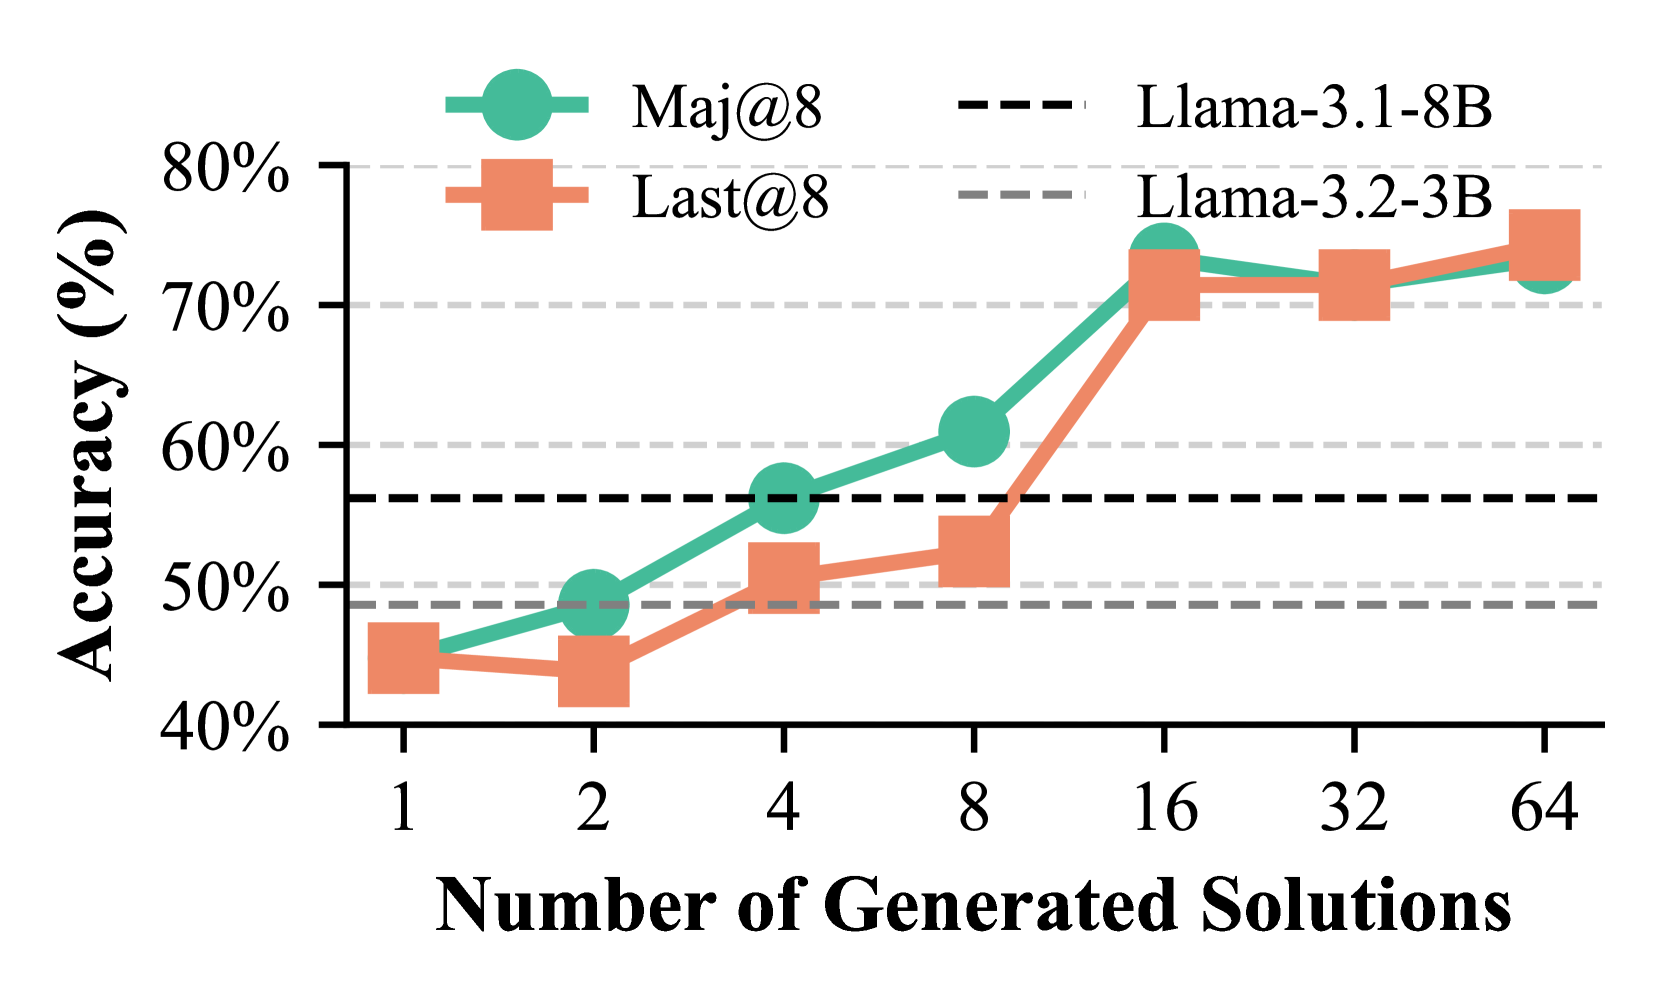
The chart compares the accuracy of two metrics, **Maj@8** (teal circles) and **Last@8** (orange squares), across different numbers of generated solutions (1, 2, 4, 8, 16, 32, 64). Two baseline models, **Llama-3.1-8B** (dashed black line) and **Llama-3.2-3B** (dashed gray line), are shown for reference. Accuracy is measured on the y-axis (40%–80%), while the x-axis represents the number of generated solutions.
---
### Components/Axes
- **X-axis**: "Number of Generated Solutions" (logarithmic scale: 1, 2, 4, 8, 16, 32, 64).
- **Y-axis**: "Accuracy (%)" (linear scale: 40%–80%).
- **Legend**:
- **Maj@8**: Teal circles (solid line).
- **Last@8**: Orange squares (solid line).
- **Llama-3.1-8B**: Dashed black line.
- **Llama-3.2-3B**: Dashed gray line.
---
### Detailed Analysis
1. **Maj@8 (Teal Circles)**:
- Starts at ~45% accuracy for 1 solution.
- Increases steadily to ~75% at 16 solutions.
- Plateaus at ~73% for 32 and 64 solutions.
2. **Last@8 (Orange Squares)**:
- Begins at ~43% for 1 solution.
- Rises to ~75% at 16 solutions.
- Slightly increases to ~76% at 64 solutions.
3. **Baselines**:
- **Llama-3.1-8B** (dashed black): Horizontal at ~50%.
- **Llama-3.2-3B** (dashed gray): Horizontal at ~45%.
---
### Key Observations
- Both **Maj@8** and **Last@8** show significant accuracy improvements as the number of generated solutions increases, with the steepest gains between 1 and 16 solutions.
- **Maj@8** consistently outperforms **Last@8** at lower solution counts (e.g., 1–8 solutions), but the gap narrows at higher counts (e.g., 16–64 solutions).
- The baselines (**Llama-3.1-8B** and **Llama-3.2-3B**) are below the data points, indicating that the evaluated models outperform these baselines.
- Accuracy plateaus for both metrics after 16 solutions, suggesting diminishing returns beyond this point.
---
### Interpretation
The chart demonstrates that generating more solutions improves accuracy up to a critical threshold (16 solutions), after which further increases yield minimal gains. This suggests that the models are optimized for a specific number of solutions, and excessive generation may not enhance performance. The convergence of **Maj@8** and **Last@8** at higher solution counts implies that both metrics align in their evaluation of solution quality at scale. The baselines highlight that the models under evaluation are more effective than the referenced Llama versions, particularly for larger solution sets.