## Scatter Plot: Accuracy vs. Time-to-Answer
### Overview
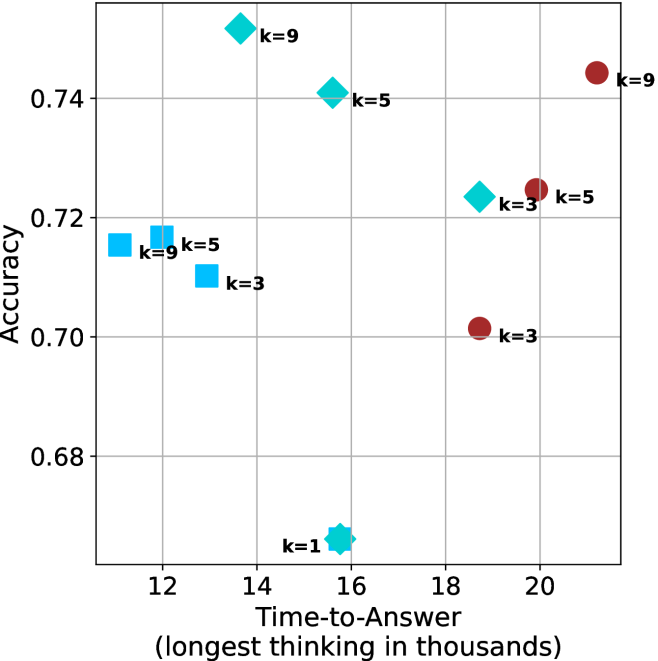
This image presents a scatter plot visualizing the relationship between Accuracy and Time-to-Answer, with data points differentiated by the value of 'k'. The plot appears to explore the trade-off between speed (Time-to-Answer) and correctness (Accuracy) for different values of 'k'.
### Components/Axes
* **X-axis:** Time-to-Answer (longest thinking in thousands). Scale ranges from approximately 11.5 to 21.
* **Y-axis:** Accuracy. Scale ranges from approximately 0.67 to 0.75.
* **Data Points:** Scatter plot points, each representing a data instance. The points are color-coded based on the value of 'k'.
* **Legend:** Located in the top-right corner, the legend maps colors to 'k' values:
* Blue: k=1
* Light Blue: k=3
* Light Green: k=5
* Dark Green: k=9
* Red: k=3
### Detailed Analysis
The plot contains several data points, each labeled with its corresponding 'k' value. Let's analyze the data points by 'k' value and their approximate coordinates:
* **k=1:** One data point, located at approximately (15.5, 0.67).
* **k=3:** Three data points:
* (14.5, 0.72)
* (18.5, 0.70)
* (19.5, 0.72)
* **k=5:** Three data points:
* (12.5, 0.72)
* (14.5, 0.74)
* (20.0, 0.72)
* **k=9:** Three data points:
* (13.5, 0.75)
* (18.0, 0.73)
* (20.5, 0.74)
**Trends:**
* **k=1:** The single point suggests a low accuracy and relatively fast Time-to-Answer.
* **k=3:** The points show a wider range of Time-to-Answer (14.5 to 19.5) with accuracy fluctuating around 0.72 and 0.70.
* **k=5:** The points show a range of Time-to-Answer (12.5 to 20.0) with accuracy fluctuating around 0.72 and 0.74.
* **k=9:** The points show a range of Time-to-Answer (13.5 to 20.5) with accuracy fluctuating around 0.73 and 0.75.
Generally, as 'k' increases, the Time-to-Answer tends to increase, and the Accuracy also tends to increase, but this is not a strict monotonic relationship.
### Key Observations
* There is a general positive correlation between 'k' and both Time-to-Answer and Accuracy.
* For k=3, there is a significant spread in Time-to-Answer values, while the accuracy remains relatively consistent.
* The highest accuracy is achieved with k=9, but it also requires the longest Time-to-Answer.
* There is overlap in the Time-to-Answer ranges for different 'k' values, indicating that achieving a certain speed does not necessarily dictate a specific accuracy level.
### Interpretation
The data suggests that increasing the value of 'k' generally improves accuracy but at the cost of increased Time-to-Answer. 'k' likely represents a parameter controlling the complexity or thoroughness of the process being evaluated. A higher 'k' might involve more extensive computation or consideration of more factors, leading to better results but slower processing.
The spread of data points for k=3 indicates that there are multiple ways to achieve similar accuracy levels with this parameter setting, potentially due to variations in the input data or the underlying algorithm.
The plot highlights a trade-off between speed and accuracy, which is a common consideration in many applications. The optimal value of 'k' would depend on the specific requirements of the task, balancing the need for accurate results with the constraints of time or computational resources. The red data points for k=3 are interesting, as they are clustered together, suggesting a specific behavior or condition for that parameter value.