## Line Charts: Performance Comparison of "Late" and "Early" Strategies
### Overview
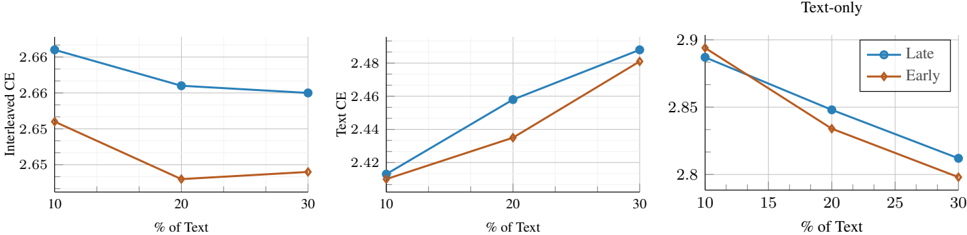
The image presents three line charts comparing the performance of "Late" and "Early" strategies across different percentages of text. The charts are titled "Interleaved CE", "Text CE", and "Text-only". Each chart plots the performance metric (CE - Cross Entropy) against the percentage of text, ranging from 10% to 30%. The "Late" strategy is represented by a blue line with circular markers, while the "Early" strategy is represented by a brown line with diamond markers.
### Components/Axes
* **X-axis (all charts):** "% of Text", with tick marks at 10, 20, and 30. The "Text-only" chart has additional tick marks at 15 and 25.
* **Y-axis (left chart):** "Interleaved CE", ranging from approximately 2.65 to 2.66.
* **Y-axis (middle chart):** "Text CE", ranging from approximately 2.42 to 2.48.
* **Y-axis (right chart):** No label, but the chart is titled "Text-only", ranging from approximately 2.8 to 2.9.
* **Legend (top-right of the rightmost chart):**
* Blue line with circular markers: "Late"
* Brown line with diamond markers: "Early"
### Detailed Analysis
**Chart 1: Interleaved CE**
* **Late (Blue):** The line starts at approximately 2.662 at 10% text, decreases to approximately 2.661 at 20% text, and remains relatively constant at approximately 2.660 at 30% text.
* **Early (Brown):** The line starts at approximately 2.652 at 10% text, decreases to approximately 2.648 at 20% text, and increases slightly to approximately 2.649 at 30% text.
**Chart 2: Text CE**
* **Late (Blue):** The line starts at approximately 2.415 at 10% text, increases to approximately 2.458 at 20% text, and continues to increase to approximately 2.480 at 30% text.
* **Early (Brown):** The line starts at approximately 2.410 at 10% text, increases to approximately 2.433 at 20% text, and continues to increase to approximately 2.470 at 30% text.
**Chart 3: Text-only**
* **Late (Blue):** The line starts at approximately 2.890 at 10% text, decreases to approximately 2.850 at 20% text, and continues to decrease to approximately 2.815 at 30% text.
* **Early (Brown):** The line starts at approximately 2.885 at 10% text, decreases to approximately 2.830 at 20% text, and continues to decrease to approximately 2.800 at 30% text.
### Key Observations
* In the "Interleaved CE" chart, the "Late" strategy consistently outperforms the "Early" strategy, although the difference is minimal. Both strategies show a slight decrease in CE as the percentage of text increases.
* In the "Text CE" chart, both strategies show an increasing trend in CE as the percentage of text increases. The "Late" strategy consistently outperforms the "Early" strategy.
* In the "Text-only" chart, both strategies show a decreasing trend in CE as the percentage of text increases. The "Late" strategy consistently outperforms the "Early" strategy.
### Interpretation
The charts compare the performance of "Late" and "Early" strategies under different conditions ("Interleaved CE", "Text CE", and "Text-only") with varying percentages of text. The "Late" strategy generally outperforms the "Early" strategy across all conditions.
* **Interleaved CE:** The slight decrease in CE with increasing text percentage suggests that both strategies benefit marginally from more text when the context is interleaved.
* **Text CE:** The increasing CE with increasing text percentage suggests that both strategies perform better with more text when focusing solely on text-based cross-entropy.
* **Text-only:** The decreasing CE with increasing text percentage suggests that both strategies benefit from more text when the model is trained on text only.
The consistent outperformance of the "Late" strategy suggests that processing text later in the model architecture is generally more effective than processing it early, regardless of the specific condition. The magnitude of the performance difference varies depending on the condition, with the "Text CE" chart showing the most significant difference between the two strategies.