## Line Charts: Inferred CE, Text CE, and Text-only vs. % of Text
### Overview
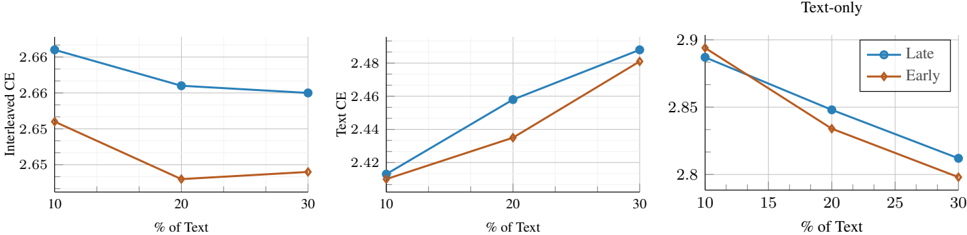
The image displays three separate line charts arranged horizontally. Each chart plots a different metric (y-axis) against the percentage of text used (x-axis), comparing two conditions labeled "Late" and "Early". The charts appear to analyze the performance or cost (CE likely stands for Cross-Entropy) of a model or system as the amount of textual data varies.
### Components/Axes
* **Common X-Axis (All Charts):** Label: `% of Text`. Ticks/Values: `10`, `20`, `30`.
* **Left Chart:**
* **Title/Y-Axis Label:** `Inferred CE`
* **Y-Axis Scale:** Ranges from approximately 2.645 to 2.665. Major ticks at 2.65, 2.66.
* **Middle Chart:**
* **Title/Y-Axis Label:** `Text CE`
* **Y-Axis Scale:** Ranges from approximately 2.41 to 2.49. Major ticks at 2.42, 2.44, 2.46, 2.48.
* **Right Chart:**
* **Title/Y-Axis Label:** `Text-only`
* **Y-Axis Scale:** Ranges from approximately 2.80 to 2.90. Major ticks at 2.8, 2.85, 2.9.
* **Legend (Present in Right Chart, applies to all):**
* **Position:** Top-right corner of the rightmost chart.
* **Series 1:** Label: `Late`. Visual: Blue line with circular markers.
* **Series 2:** Label: `Early`. Visual: Orange line with diamond markers.
### Detailed Analysis
**1. Left Chart: Inferred CE**
* **Trend Verification:** Both lines show a general downward trend from 10% to 30% text, with a slight uptick for the "Early" line at 30%. The "Late" line is consistently above the "Early" line.
* **Data Points (Approximate):**
* **Late (Blue, Circles):**
* 10% Text: ~2.663
* 20% Text: ~2.661
* 30% Text: ~2.660
* **Early (Orange, Diamonds):**
* 10% Text: ~2.652
* 20% Text: ~2.647
* 30% Text: ~2.648
**2. Middle Chart: Text CE**
* **Trend Verification:** Both lines show a clear upward trend from 10% to 30% text. The "Late" line is consistently above the "Early" line.
* **Data Points (Approximate):**
* **Late (Blue, Circles):**
* 10% Text: ~2.415
* 20% Text: ~2.458
* 30% Text: ~2.488
* **Early (Orange, Diamonds):**
* 10% Text: ~2.412
* 20% Text: ~2.435
* 30% Text: ~2.482
**3. Right Chart: Text-only**
* **Trend Verification:** Both lines show a clear downward trend from 10% to 30% text. The "Late" line is consistently above the "Early" line.
* **Data Points (Approximate):**
* **Late (Blue, Circles):**
* 10% Text: ~2.885
* 20% Text: ~2.850
* 30% Text: ~2.810
* **Early (Orange, Diamonds):**
* 10% Text: ~2.895
* 20% Text: ~2.835
* 30% Text: ~2.800
### Key Observations
1. **Consistent Hierarchy:** In all three metrics and at all data points, the "Late" condition results in a higher CE value than the "Early" condition.
2. **Divergent Trends:** The metrics respond oppositely to increasing text percentage.
* **Inferred CE** and **Text-only** metrics *decrease* as more text is used.
* **Text CE** metric *increases* as more text is used.
3. **Magnitude of Change:** The "Text CE" metric shows the most significant relative increase (from ~2.41 to ~2.49), while the "Text-only" metric shows the most significant absolute decrease (from ~2.89 to ~2.80).
### Interpretation
The data suggests a trade-off or inverse relationship between the "Text CE" cost and the other two metrics ("Inferred CE" and "Text-only") as the system is exposed to more textual data.
* **"Text CE" Increasing:** This likely represents the cross-entropy loss on the text modeling objective itself. As the percentage of text in the training or input data increases, the model's task of accurately predicting that text becomes more challenging or the loss is calculated over a larger, potentially noisier set, leading to a higher CE value.
* **"Inferred CE" & "Text-only" Decreasing:** These metrics likely measure performance on downstream or auxiliary tasks. "Inferred CE" could be loss on inferred labels or a separate modality, while "Text-only" might be a specialized evaluation. Their improvement (lower CE) with more text suggests that increased textual data helps the model generalize better or learn representations that benefit these other tasks, even as the core text modeling loss rises.
* **"Late" vs. "Early":** The consistent gap where "Late" has higher CE values across all charts could indicate that a later stage of training, a later fusion point in a model architecture, or a condition with delayed information access is less efficient (higher loss) than an "Early" counterpart, regardless of the amount of text provided.
In summary, the charts illustrate that simply adding more text data doesn't uniformly improve all aspects of model performance. It improves outcomes on inferred and text-only tasks but makes the primary text modeling task appear harder (higher loss). The "Early" condition is consistently more efficient (lower loss) than the "Late" condition.