## Line Chart: InternVL2.5-8B Overall Performance
### Overview
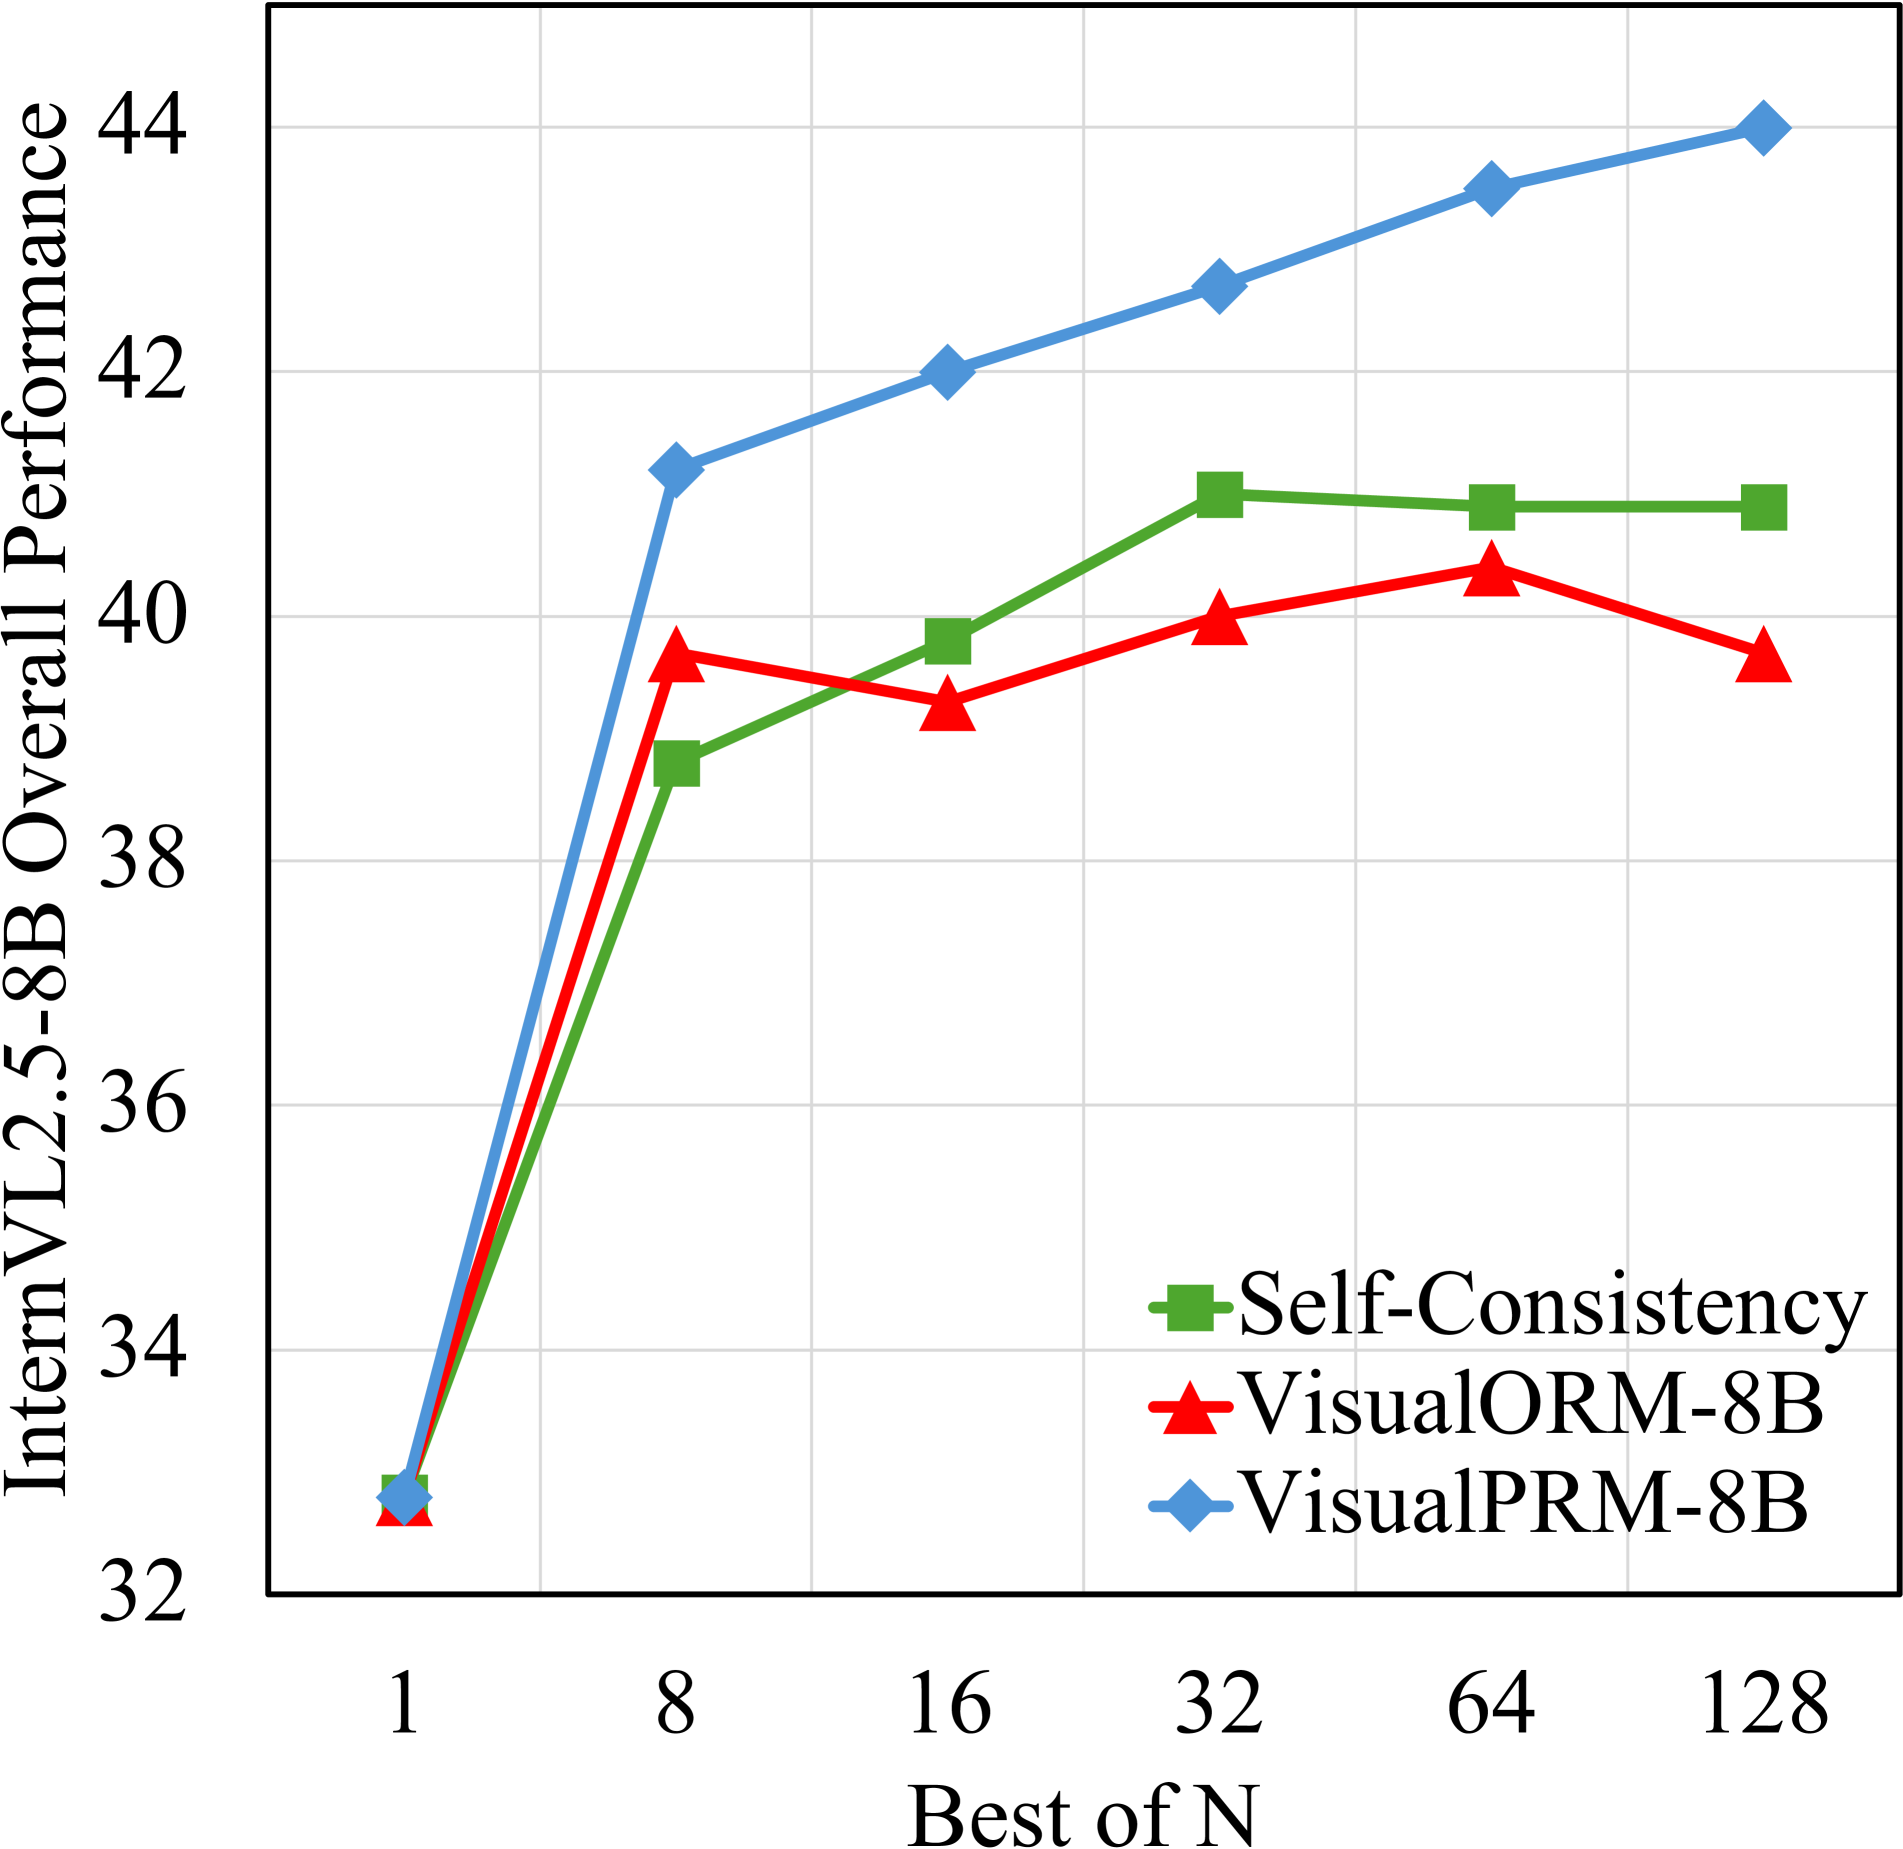
The image is a line chart comparing the overall performance of three different models: "Self-Consistency", "VisualORM-8B", and "VisualPRM-8B". The x-axis represents "Best of N", with values ranging from 1 to 128. The y-axis represents "InternVL2.5-8B Overall Performance", with values ranging from 32 to 44.
### Components/Axes
* **X-axis:** "Best of N" with markers at 1, 8, 16, 32, 64, and 128.
* **Y-axis:** "InternVL2.5-8B Overall Performance" with markers at 32, 34, 36, 38, 40, 42, and 44.
* **Legend:** Located at the bottom-right of the chart.
* Green line with square markers: "Self-Consistency"
* Red line with triangle markers: "VisualORM-8B"
* Blue line with diamond markers: "VisualPRM-8B"
### Detailed Analysis
* **Self-Consistency (Green):**
* Trend: Increases sharply from N=1 to N=8, then increases less sharply from N=8 to N=32, then remains relatively flat from N=32 to N=128.
* Data Points:
* N=1: ~32.7
* N=8: ~38.8
* N=16: ~39.7
* N=32: ~41.0
* N=64: ~40.9
* N=128: ~40.9
* **VisualORM-8B (Red):**
* Trend: Increases sharply from N=1 to N=8, then decreases slightly from N=8 to N=16, then increases from N=16 to N=64, then decreases from N=64 to N=128.
* Data Points:
* N=1: ~32.6
* N=8: ~39.6
* N=16: ~39.2
* N=32: ~39.9
* N=64: ~40.3
* N=128: ~39.5
* **VisualPRM-8B (Blue):**
* Trend: Increases sharply from N=1 to N=8, then increases steadily from N=8 to N=128.
* Data Points:
* N=1: ~32.8
* N=8: ~41.2
* N=16: ~42.0
* N=32: ~42.7
* N=64: ~43.3
* N=128: ~44.0
### Key Observations
* VisualPRM-8B consistently outperforms the other two models across all values of "Best of N".
* Self-Consistency and VisualORM-8B have similar performance at N=1, but diverge significantly as N increases.
* The performance of VisualORM-8B peaks at N=64 and then declines slightly.
* The performance of Self-Consistency plateaus after N=32.
### Interpretation
The chart demonstrates that increasing the "Best of N" parameter generally improves the overall performance of the InternVL2.5-8B model. However, the extent of improvement varies depending on the specific model configuration. VisualPRM-8B shows the most consistent and significant improvement with increasing N, suggesting it benefits the most from this parameter. The plateauing or slight decline in performance for Self-Consistency and VisualORM-8B at higher N values may indicate diminishing returns or potential overfitting.