## Line Chart: InternVL2.5-8B Overall Performance vs. Best of N
### Overview
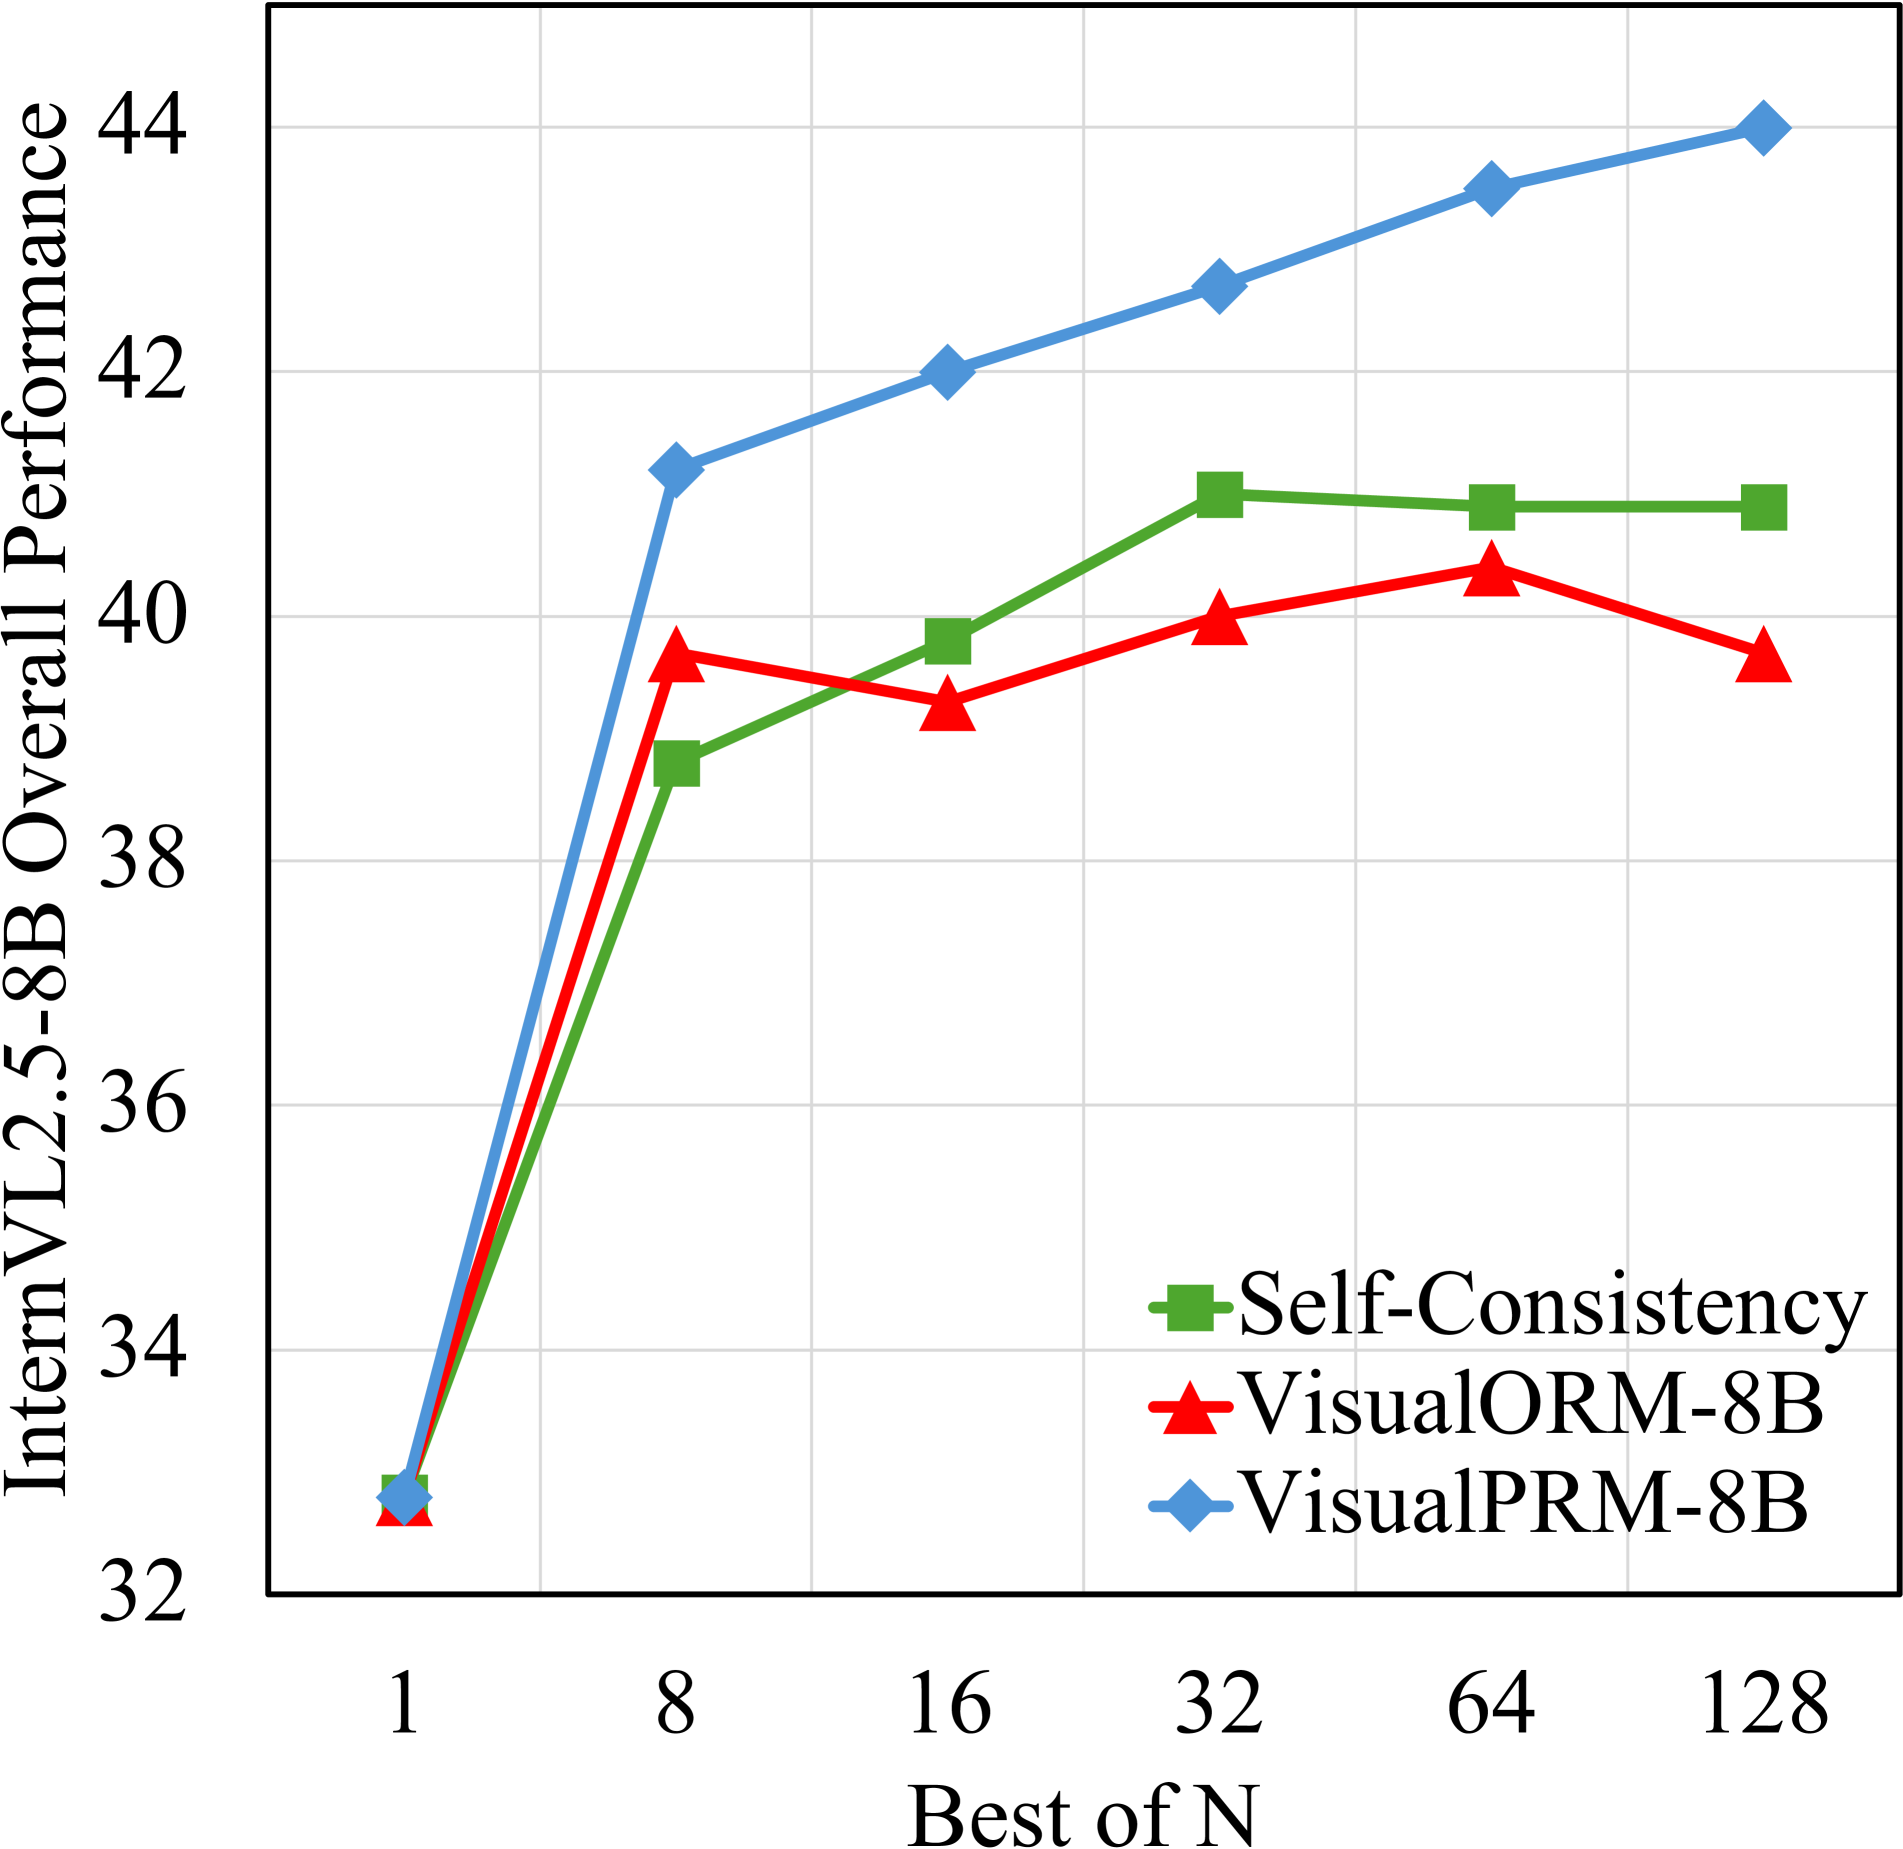
This line chart depicts the relationship between the "Best of N" parameter and the "InternVL2.5-8B Overall Performance" for three different models: Self-Consistency, VisualORM-8B, and VisualPRM-8B. The chart shows how performance changes as the number of samples ("N") considered increases.
### Components/Axes
* **X-axis:** "Best of N" - Values are 1, 8, 16, 32, 64, and 128.
* **Y-axis:** "InternVL2.5-8B Overall Performance" - Values range from approximately 32 to 44.
* **Legend:** Located in the bottom-right corner.
* Green Square: "Self-Consistency"
* Red Triangle: "VisualORM-8B"
* Blue Diamond: "VisualPRM-8B"
* **Gridlines:** Present to aid in reading values.
### Detailed Analysis
* **VisualPRM-8B (Blue Diamond):** This line shows a strong upward trend.
* At N=1, performance is approximately 32.5.
* At N=8, performance jumps to approximately 41.5.
* At N=16, performance is approximately 42.2.
* At N=32, performance is approximately 42.7.
* At N=64, performance is approximately 43.5.
* At N=128, performance reaches approximately 44.0.
* **VisualORM-8B (Red Triangle):** This line shows an initial steep increase, followed by a leveling off.
* At N=1, performance is approximately 32.2.
* At N=8, performance increases to approximately 39.5.
* At N=16, performance is approximately 39.8.
* At N=32, performance is approximately 40.2.
* At N=64, performance is approximately 40.5.
* At N=128, performance is approximately 40.7.
* **Self-Consistency (Green Square):** This line shows a moderate increase, with a plateau after N=32.
* At N=1, performance is approximately 34.0.
* At N=8, performance increases to approximately 39.0.
* At N=16, performance is approximately 39.5.
* At N=32, performance is approximately 41.0.
* At N=64, performance is approximately 41.2.
* At N=128, performance is approximately 41.2.
### Key Observations
* VisualPRM-8B consistently outperforms both VisualORM-8B and Self-Consistency across all values of N.
* The performance gains for VisualPRM-8B are most significant between N=1 and N=8.
* VisualORM-8B shows a rapid initial improvement, but its performance plateaus relatively quickly.
* Self-Consistency exhibits the slowest rate of improvement and reaches a plateau at a lower performance level than the other two models.
* All three models show diminishing returns as N increases beyond 32.
### Interpretation
The data suggests that increasing the number of samples considered ("Best of N") generally improves the overall performance of these models. However, the extent of this improvement varies significantly depending on the model architecture. VisualPRM-8B appears to benefit the most from increasing N, indicating that it is more sensitive to sample diversity or benefits from a more robust selection process. VisualORM-8B shows a strong initial gain, but its performance quickly stabilizes, suggesting that it may reach its optimal performance with a smaller number of samples. Self-Consistency demonstrates the least improvement, potentially indicating limitations in its underlying mechanism for leveraging multiple samples. The diminishing returns observed at higher values of N suggest that there is a point at which the cost of considering additional samples outweighs the performance benefits. This information is valuable for optimizing the inference process of these models, balancing performance gains with computational efficiency.