## Performance Comparison Line Chart: Scaling Behavior of Three Methods on InternVL2.5-8B
### Overview
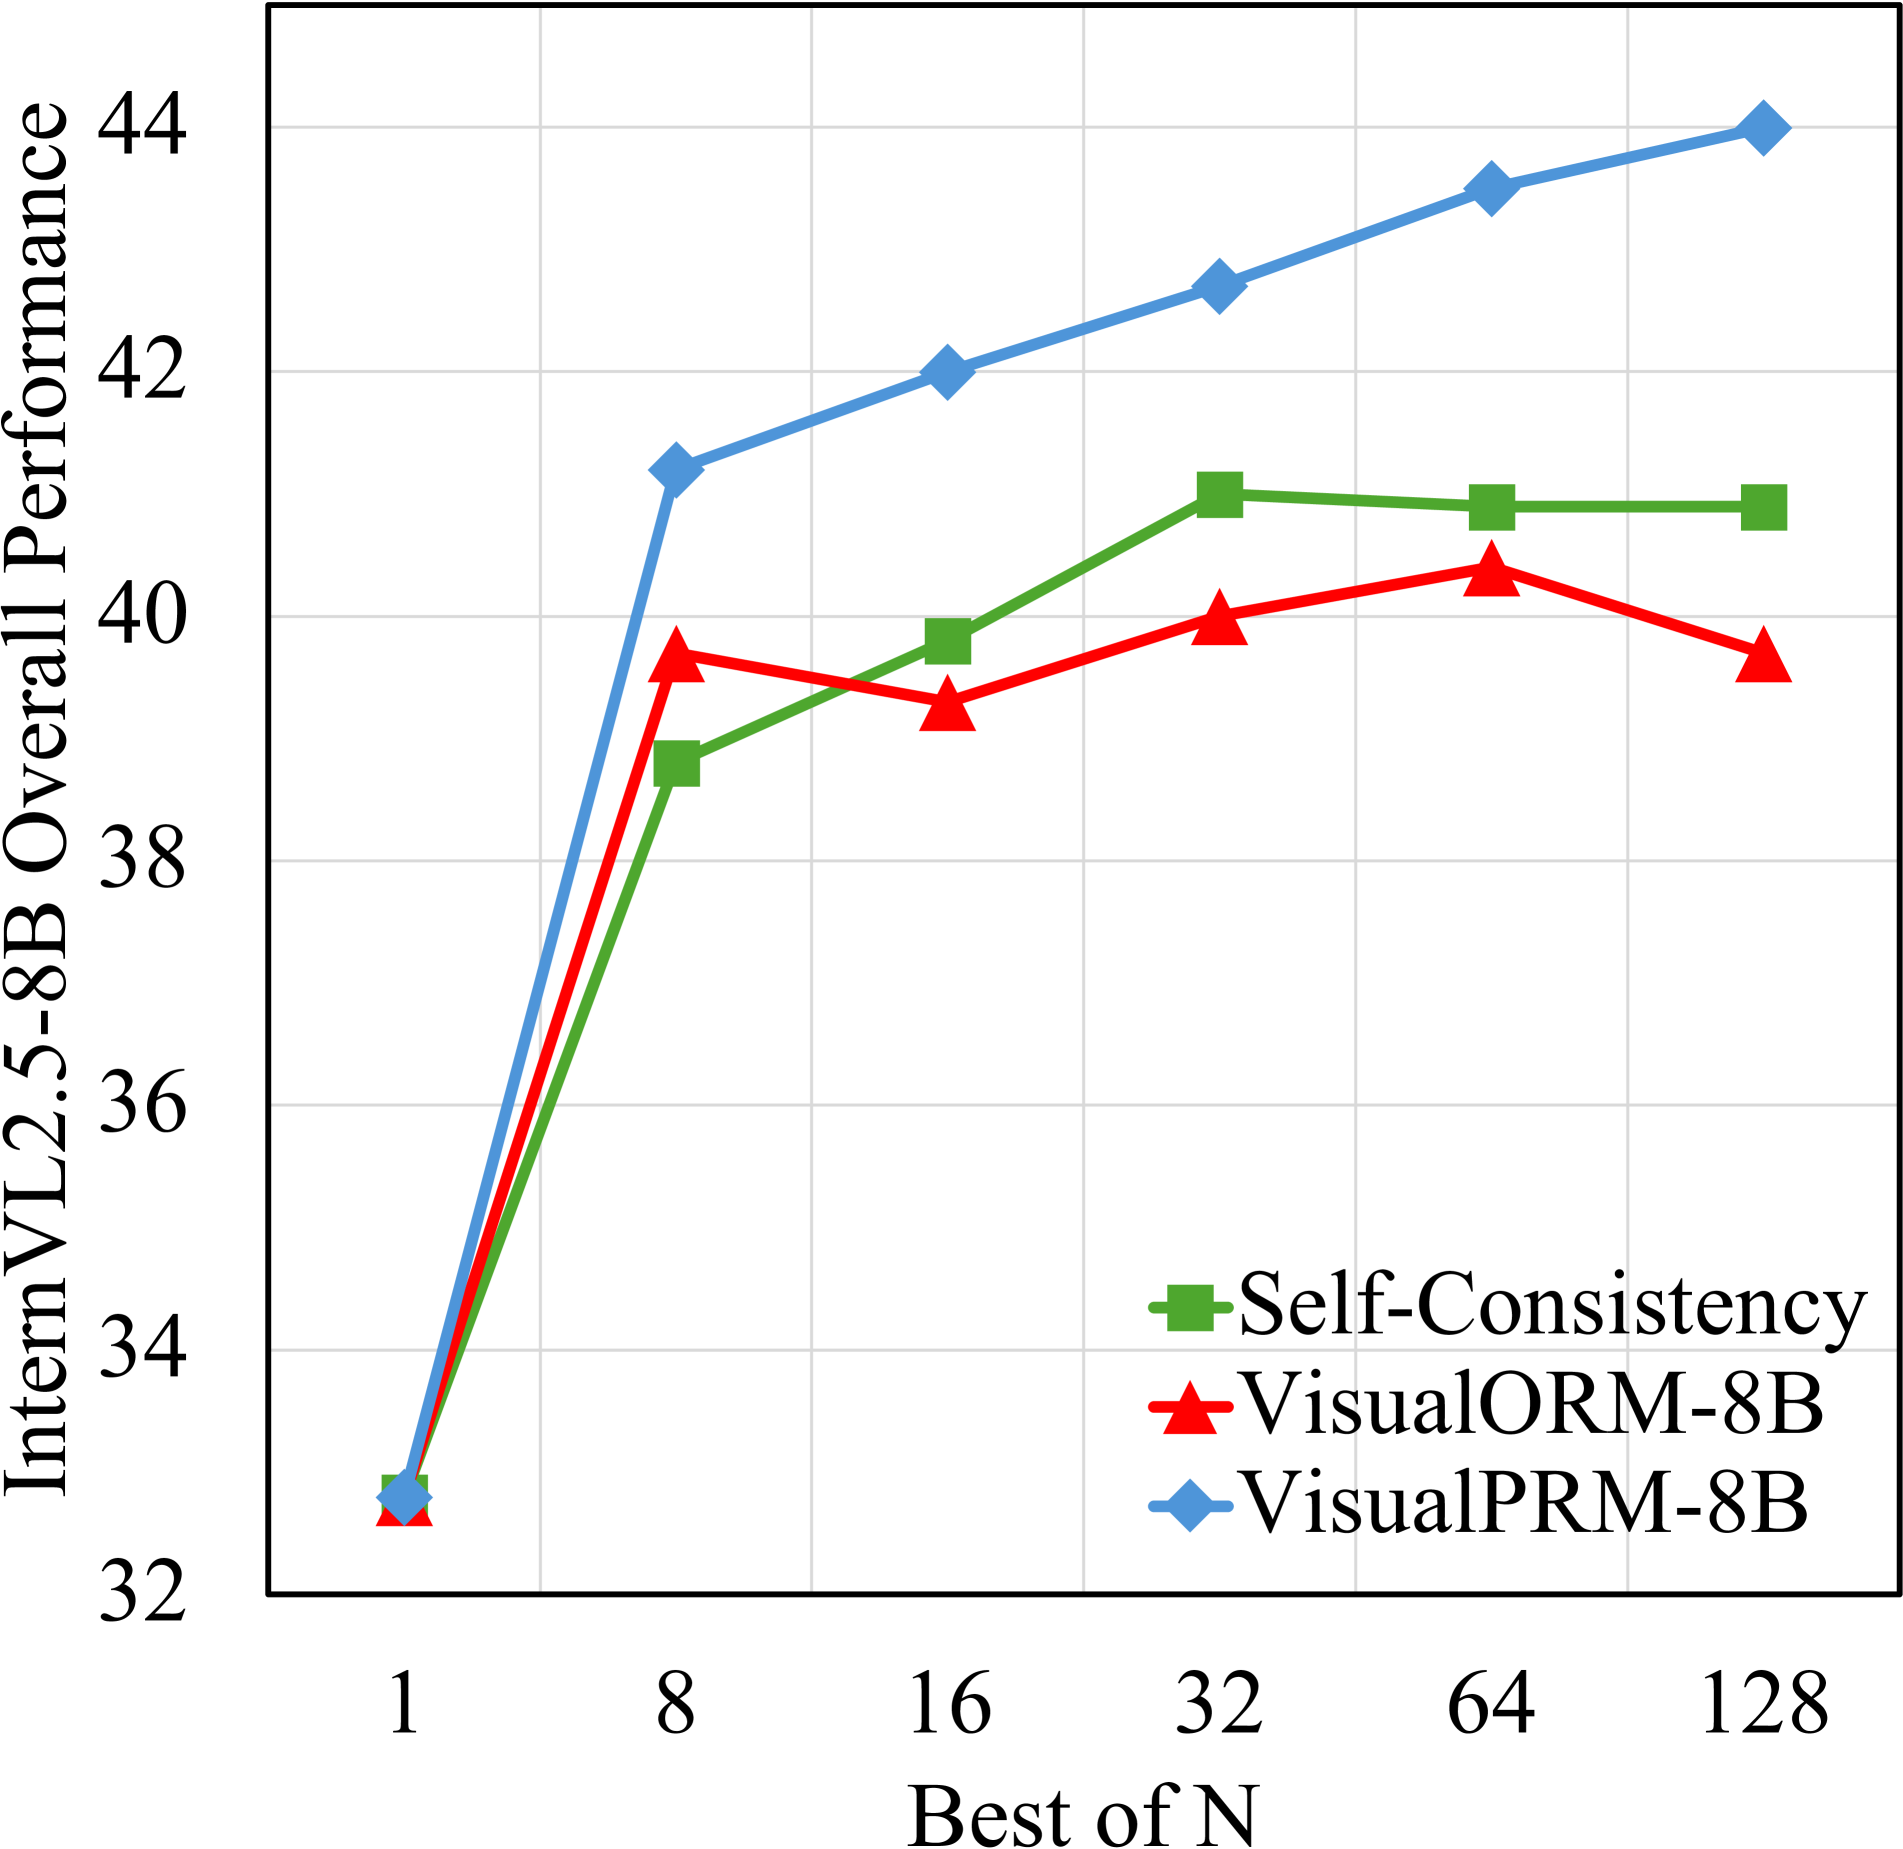
The image is a line chart comparing the performance of three different methods—Self-Consistency, VisualORM-8B, and VisualPRM-8B—on the "InternVL2.5-8B Overall Performance" benchmark. The performance is plotted against an increasing "Best of N" parameter, which likely represents the number of samples or attempts from which the best result is selected. The chart demonstrates how each method's performance scales as N increases.
### Components/Axes
* **Chart Type:** Line chart with markers.
* **Y-Axis (Vertical):**
* **Label:** "InternVL2.5-8B Overall Performance" (text is rotated 90 degrees).
* **Scale:** Linear scale ranging from 32 to 44, with major gridlines at intervals of 2 (32, 34, 36, 38, 40, 42, 44).
* **X-Axis (Horizontal):**
* **Label:** "Best of N".
* **Scale:** Categorical scale with discrete, non-linearly spaced values: 1, 8, 16, 32, 64, 128.
* **Legend:**
* **Position:** Bottom-right corner of the plot area.
* **Items:**
1. **Green Square Marker:** "Self-Consistency"
2. **Red Triangle Marker:** "VisualORM-8B"
3. **Blue Diamond Marker:** "VisualPRM-8B"
* **Grid:** Light gray gridlines are present for both axes.
### Detailed Analysis
Data points are extracted by matching the marker color/shape to the legend and reading the approximate y-axis value for each x-axis category.
**1. VisualPRM-8B (Blue Diamond Line)**
* **Trend:** Shows a strong, consistent upward trend across all values of N. The slope is steepest between N=1 and N=8, then continues to rise steadily.
* **Data Points (Approximate):**
* N=1: ~32.8
* N=8: ~41.2
* N=16: ~42.0
* N=32: ~42.6
* N=64: ~43.5
* N=128: ~44.0
**2. Self-Consistency (Green Square Line)**
* **Trend:** Increases sharply from N=1 to N=8, continues to rise to N=32, then plateaus for N=64 and N=128.
* **Data Points (Approximate):**
* N=1: ~32.8 (overlaps with other points)
* N=8: ~38.8
* N=16: ~39.8
* N=32: ~41.0
* N=64: ~40.9
* N=128: ~40.9
**3. VisualORM-8B (Red Triangle Line)**
* **Trend:** Increases from N=1 to N=8, dips slightly at N=16, rises again to a peak at N=64, then decreases at N=128. It exhibits the most fluctuation.
* **Data Points (Approximate):**
* N=1: ~32.8 (overlaps with other points)
* N=8: ~39.6
* N=16: ~39.3
* N=32: ~40.0
* N=64: ~40.4
* N=128: ~39.7
### Key Observations
1. **Common Starting Point:** All three methods begin at approximately the same performance level (~32.8) when N=1.
2. **Divergence at N=8:** A significant performance gap opens at N=8, with VisualPRM-8B (~41.2) clearly outperforming VisualORM-8B (~39.6) and Self-Consistency (~38.8).
3. **VisualPRM-8B Dominance:** The blue line (VisualPRM-8B) remains the top-performing method for all N > 1, and its lead widens as N increases.
4. **Plateau vs. Fluctuation:** Self-Consistency performance stabilizes after N=32, while VisualORM-8B shows non-monotonic behavior, peaking at N=64 before declining.
5. **Scaling Efficiency:** VisualPRM-8B demonstrates the most efficient and consistent scaling with increased N, suggesting it benefits most from additional sampling/compute.
### Interpretation
This chart evaluates how different techniques improve the reliability or accuracy of the InternVL2.5-8B model when allowed multiple attempts ("Best of N"). The data suggests:
* **VisualPRM-8B is the most effective scaling method.** Its steady, near-linear improvement indicates a robust mechanism for leveraging additional samples to find better solutions. This could imply a superior reward model or verification process that consistently identifies higher-quality outputs.
* **Self-Consistency offers reliable but limited gains.** It provides a solid improvement over the single-sample baseline but hits a performance ceiling around N=32, indicating diminishing returns. This is typical of majority-voting or consensus-based approaches.
* **VisualORM-8B is less stable.** Its fluctuating performance, especially the drop at N=128, suggests its method for selecting the "best" output may be sensitive to noise or can become counterproductive with too many samples. It does not scale as reliably as the other methods.
**Overall Implication:** For tasks where computational cost (increasing N) is acceptable, **VisualPRM-8B is the clear choice** for maximizing model performance on this benchmark. The chart provides strong evidence that its underlying approach scales better than the alternatives tested.