\n
## [Chart Type]: Dual-Panel Research Publication Trend Analysis
### Overview
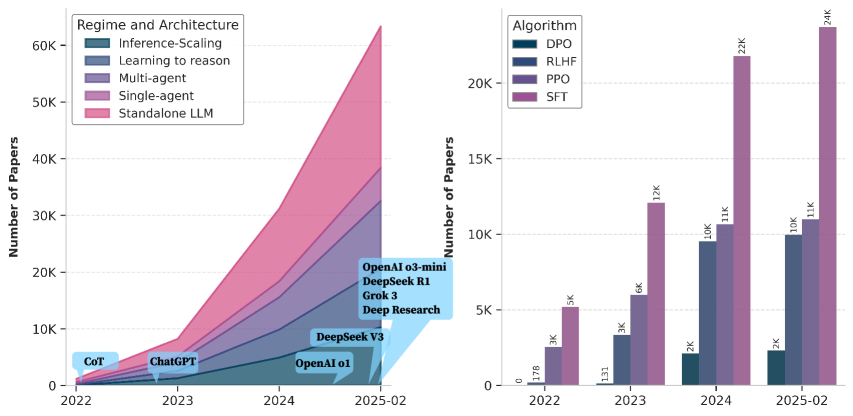
The image displays two side-by-side charts analyzing the growth of academic papers in the field of Artificial Intelligence, specifically focusing on Large Language Models (LLMs) and related training methodologies. The left chart is a **stacked area chart** showing the growth of papers by "Regime and Architecture." The right chart is a **grouped bar chart** showing the growth of papers by "Algorithm." Both charts share the same x-axis timeline from 2022 to February 2025 and the same y-axis metric: "Number of Papers."
### Components/Axes
**Shared Elements:**
* **X-Axis (Both Charts):** Timeline with markers for "2022", "2023", "2024", and "2025-02".
* **Y-Axis (Both Charts):** "Number of Papers", with a scale from 0 to 60K on the left chart and 0 to 20K+ on the right chart.
**Left Chart: "Regime and Architecture"**
* **Chart Type:** Stacked Area Chart.
* **Legend (Top-Left):** Contains five categories, each associated with a specific color:
1. `Inference-Scaling` (Dark Teal)
2. `Learning to reason` (Medium Blue)
3. `Multi-agent` (Purple)
4. `Single-agent` (Magenta)
5. `Standalone LLM` (Pink)
* **Annotations:** Text labels with arrows pointing to specific points on the timeline, indicating major model releases or concepts:
* `CoT` (pointing to early 2022)
* `ChatGPT` (pointing to late 2022/early 2023)
* `OpenAI o1` (pointing to mid-2024)
* `DeepSeek V3` (pointing to late 2024)
* A blue box in the top-right corner lists: `OpenAI o3-mini`, `DeepSeek R1`, `Grok 3`, `Deep Research`.
**Right Chart: "Algorithm"**
* **Chart Type:** Grouped Bar Chart.
* **Legend (Top-Left):** Contains four categories, each associated with a specific color:
1. `DPO` (Dark Teal)
2. `RLHF` (Medium Blue)
3. `PPO` (Purple)
4. `SFT` (Magenta)
* **Data Labels:** Numerical values are printed directly on top of each bar.
### Detailed Analysis
**Left Chart: Regime and Architecture Trends**
* **Trend Verification:** All five stacked areas show a clear, accelerating upward trend from 2022 to 2025-02. The total height of the stack (sum of all categories) grows from near zero in 2022 to over 60,000 papers by February 2025.
* **Data Point Extraction (Approximate, based on visual stack height):**
* **2022:** Total papers are minimal (< 1K). The stack is dominated by `Standalone LLM` and `Single-agent`.
* **2023:** Total papers rise to approximately 10K. `Standalone LLM` and `Single-agent` remain the largest segments. The `Multi-agent` and `Learning to reason` segments become visible.
* **2024:** Total papers surge to approximately 35K. `Standalone LLM` is the largest single segment, followed by `Single-agent`. `Multi-agent` and `Learning to reason` show significant growth. `Inference-Scaling` is a small but distinct segment.
* **2025-02:** Total papers peak at over 60K. The order of segment size from largest to smallest appears to be: `Standalone LLM` > `Single-agent` > `Multi-agent` > `Learning to reason` > `Inference-Scaling`.
**Right Chart: Algorithm Trends**
* **Trend Verification:** All four algorithm categories show a strong upward trend. `SFT` (Magenta) is consistently the most published algorithm, followed by `PPO` (Purple) and `RLHF` (Medium Blue). `DPO` (Dark Teal) has the lowest publication count but also shows growth.
* **Data Point Extraction (Exact values from labels):**
* **2022:** `DPO`: 170, `RLHF`: 3K, `PPO`: 5K, `SFT`: 5K.
* **2023:** `DPO`: 133, `RLHF`: 3K, `PPO`: 6K, `SFT`: 12K.
* **2024:** `DPO`: 2K, `RLHF`: 10K, `PPO`: 11K, `SFT`: 21K.
* **2025-02:** `DPO`: 2K, `RLHF`: 10K, `PPO`: 11K, `SFT`: 24K.
### Key Observations
1. **Explosive Growth:** The field experienced exponential growth in research publications between 2022 and early 2025, with the total number of papers increasing by more than an order of magnitude.
2. **Dominance of Standalone LLMs:** The "Standalone LLM" architecture is the most researched regime throughout the period, indicating a primary focus on scaling and improving base models.
3. **Algorithm Hierarchy:** Supervised Fine-Tuning (`SFT`) is the most frequently studied algorithm, suggesting it remains a foundational technique. Reinforcement Learning from Human Feedback (`RLHF`) and Proximal Policy Optimization (`PPO`) are also heavily researched. Direct Preference Optimization (`DPO`) is a newer or less dominant area.
4. **Correlation with Milestones:** The annotations on the left chart (CoT, ChatGPT, OpenAI o1, etc.) align with periods of accelerated growth, suggesting that major model releases and conceptual breakthroughs (like Chain-of-Thought) act as catalysts for research activity.
5. **Diversification:** While "Standalone LLM" leads, the significant and growing shares for "Multi-agent," "Learning to reason," and "Single-agent" indicate the field is rapidly diversifying into more complex systems and capabilities.
### Interpretation
This data visualizes the "Cambrian explosion" in LLM research following the public release of ChatGPT in late 2022. The charts tell a story of a field rapidly scaling its core technology (`Standalone LLM`, `SFT`) while simultaneously branching out into new architectural paradigms (`Multi-agent`, `Learning to reason`) and training algorithms (`RLHF`, `PPO`, `DPO`).
The left chart's stacked area format effectively shows that growth is not just in one area but across the entire ecosystem of LLM research. The right chart highlights that while new algorithms like DPO emerge, established methods like SFT and RLHF/PPO continue to dominate the research landscape, likely due to their proven utility and ongoing refinement.
The placement of model release annotations directly on the growth curve strongly implies a causal relationship: each major technical milestone (CoT, ChatGPT, o1, V3) appears to trigger a subsequent wave of research papers exploring, applying, or building upon that advancement. The blue box listing recent models (o3-mini, R1, Grok 3) in early 2025 suggests this cycle of innovation and research response is ongoing and accelerating.
**Language Note:** All text within the image is in English.