## Stacked Area Chart: Regime and Architecture Trends (2022-2025-02)
### Overview
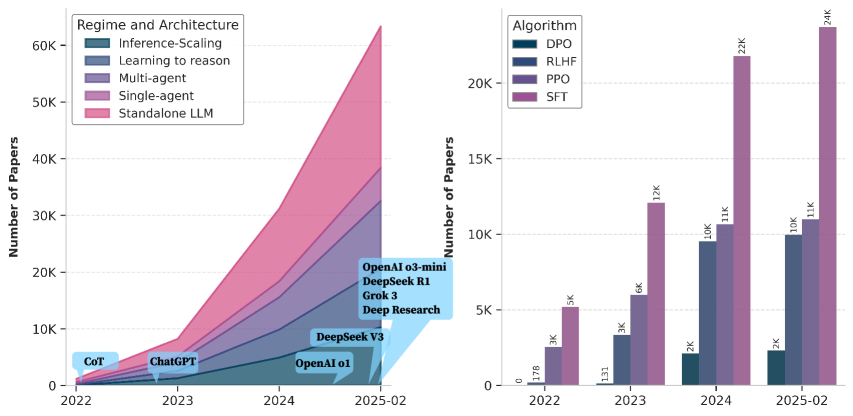
A stacked area chart showing the growth of research papers across six AI research categories from 2022 to early 2025. The y-axis represents the number of papers (log scale), and the x-axis spans four years.
### Components/Axes
- **X-axis**: Years (2022, 2023, 2024, 2025-02)
- **Y-axis**: Number of Papers (log scale, 0 to 60K)
- **Legend**:
- Inference-Scaling (dark blue)
- Learning to reason (light blue)
- Multi-agent (purple)
- Single-agent (pink)
- Standalone LLM (red)
- DeepSeek V3 (light blue, annotation)
- **Annotations**:
- "CoT" (2022, ~1K papers)
- "ChatGPT" (2023, ~1K papers)
- "OpenAI o1" (2024, ~5K papers)
- "DeepSeek V3" (2024, ~10K papers)
- "OpenAI o3-mini" (2025-02, ~20K papers)
- "DeepSeek R1" (2025-02, ~30K papers)
- "GroK 3" (2025-02, ~40K papers)
### Detailed Analysis
- **Inference-Scaling**: Smallest category, grows from ~100 (2022) to ~5K (2025-02).
- **Learning to reason**: Starts at ~200 (2022), peaks at ~10K (2025-02).
- **Multi-agent**: Minimal growth (~500 to ~8K).
- **Single-agent**: Moderate growth (~1K to ~15K).
- **Standalone LLM**: Dominates, rising from ~1K (2022) to ~60K (2025-02).
- **DeepSeek V3**: Annotated at ~10K papers in 2024.
### Key Observations
- Standalone LLM research grows exponentially, outpacing all other categories.
- Annotations highlight major model releases (e.g., ChatGPT in 2023, GroK 3 in 2025-02).
- Log scale emphasizes rapid growth in later years.
### Interpretation
The chart reflects the AI research landscape's shift toward standalone large language models (LLMs), with Standalone LLM research dominating by 2025. The annotations suggest key milestones (e.g., ChatGPT's 2023 release) correlate with spikes in related research. The log scale underscores the accelerating pace of innovation.
---
## Grouped Bar Chart: Algorithm Popularity (2022-2025-02)
### Overview
A grouped bar chart comparing four algorithms (DPO, RLHF, PPO, SFT) across four years. The y-axis shows the number of papers (log scale), and the x-axis spans 2022 to 2025-02.
### Components/Axes
- **X-axis**: Years (2022, 2023, 2024, 2025-02)
- **Y-axis**: Number of Papers (log scale, 0 to 25K)
- **Legend**:
- DPO (dark blue)
- RLHF (light blue)
- PPO (purple)
- SFT (pink)
### Detailed Analysis
- **2022**:
- DPO: ~178 papers
- RLHF: ~3K papers
- PPO: ~3K papers
- SFT: ~5K papers
- **2023**:
- DPO: ~133 papers
- RLHF: ~3K papers
- PPO: ~6K papers
- SFT: ~12K papers
- **2024**:
- DPO: ~2K papers
- RLHF: ~10K papers
- PPO: ~11K papers
- SFT: ~22K papers
- **2025-02**:
- DPO: ~2K papers
- RLHF: ~10K papers
- PPO: ~11K papers
- SFT: ~24K papers
### Key Observations
- SFT dominates all years, with a 5x increase from 2022 to 2025-02.
- RLHF and PPO show steady growth, while DPO remains stagnant.
- Log scale highlights SFT's exponential adoption.
### Interpretation
SFT (Supervised Fine-Tuning) becomes the dominant algorithm by 2025, reflecting its effectiveness in training LLMs. RLHF (Reinforcement Learning from Human Feedback) and PPO (Proximal Policy Optimization) gain traction but lag behind SFT. DPO (Direct Preference Optimization) sees minimal adoption despite its theoretical promise, suggesting practical challenges in implementation.
---
## Cross-Chart Correlation
- **Standalone LLM research** (left chart) and **SFT algorithm popularity** (right chart) are strongly correlated, both showing exponential growth.
- Annotations in the left chart (e.g., "GroK 3") align with SFT's dominance, indicating SFT's role in training these models.
- DPO's stagnation in the right chart contrasts with its theoretical potential, possibly due to implementation complexity or competition from SFT.
## Limitations
- Exact paper counts are approximate due to log scale and visual estimation.
- Annotations may not represent all significant models (e.g., missing "LLaMA" or "BERT").
- No data on regional or institutional contributions.