## Learning Rate Decay Chart
### Overview
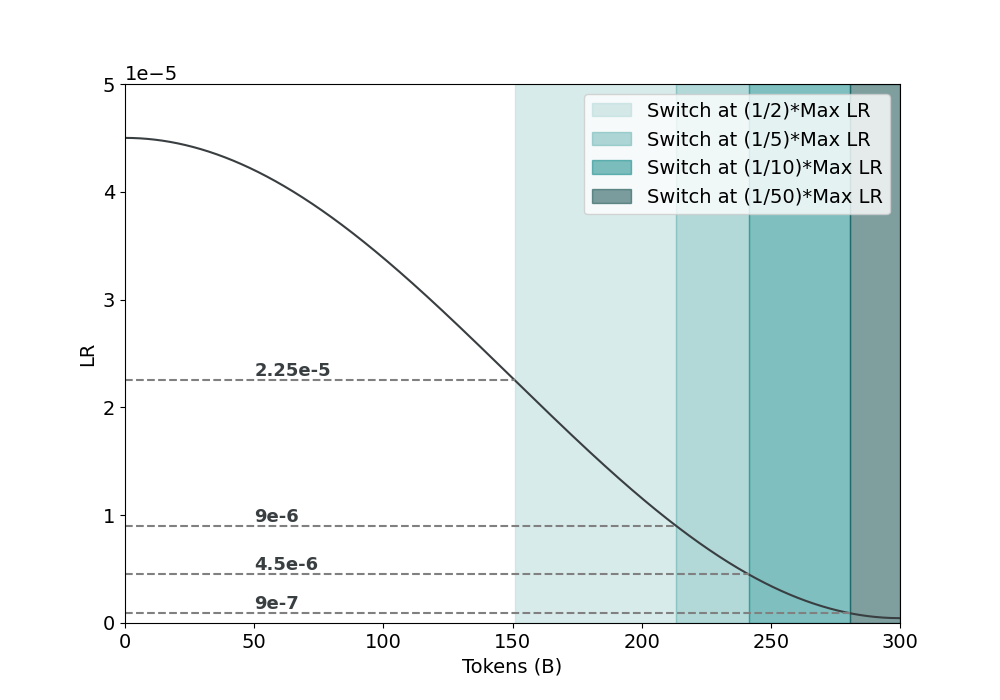
The image is a line chart illustrating the decay of the learning rate (LR) as the number of tokens increases. The x-axis represents the number of tokens (in billions), and the y-axis represents the learning rate. The chart also includes shaded regions indicating when the learning rate is switched to a fraction of the maximum learning rate (Max LR).
### Components/Axes
* **X-axis:** Tokens (B), ranging from 0 to 300.
* **Y-axis:** LR (Learning Rate), ranging from 0 to 5e-5.
* **Line:** A dark gray line showing the learning rate decay.
* **Horizontal Dashed Lines:** Representing specific learning rate values: 9e-7, 4.5e-6, 9e-6, and 2.25e-5.
* **Vertical Shaded Regions:** Indicate when the learning rate is switched to a fraction of the maximum learning rate.
* Lightest Teal: Switch at (1/2)*Max LR
* Lighter Teal: Switch at (1/5)*Max LR
* Teal: Switch at (1/10)*Max LR
* Dark Teal: Switch at (1/50)*Max LR
* **Legend:** Located in the top-right corner, explaining the meaning of the shaded regions.
### Detailed Analysis
* **Learning Rate Decay Line:**
* The line starts at approximately 4.5e-5 when the number of tokens is 0.
* The line slopes downward, indicating a decrease in the learning rate as the number of tokens increases.
* At 50 tokens, the LR is approximately 3.8e-5.
* At 100 tokens, the LR is approximately 3.0e-5.
* At 150 tokens, the LR is approximately 2.0e-5.
* At 200 tokens, the LR is approximately 1.0e-5.
* At 250 tokens, the LR is approximately 0.3e-5.
* At 300 tokens, the LR is approximately 0.1e-5.
* **Switch Points:**
* Switch at (1/2)*Max LR (Lightest Teal): Starts around 160 tokens.
* Switch at (1/5)*Max LR (Lighter Teal): Starts around 200 tokens.
* Switch at (1/10)*Max LR (Teal): Starts around 230 tokens.
* Switch at (1/50)*Max LR (Dark Teal): Starts around 260 tokens.
* **Horizontal Lines:**
* 2.25e-5: Intersects the decay line at approximately 80 tokens.
* 9e-6: Intersects the decay line at approximately 190 tokens.
* 4.5e-6: Intersects the decay line at approximately 230 tokens.
* 9e-7: Intersects the decay line at approximately 270 tokens.
### Key Observations
* The learning rate decreases non-linearly with the number of tokens. The rate of decrease slows down as the number of tokens increases.
* The "switch" points are strategically placed to reduce the learning rate at specific intervals, likely to fine-tune the model as training progresses.
* The horizontal lines provide reference points for specific learning rate values, allowing for easy comparison with the decay curve.
### Interpretation
The chart illustrates a common technique in machine learning called learning rate decay. The learning rate is initially high to allow for rapid learning, but it is gradually reduced as training progresses to prevent overshooting the optimal solution and to fine-tune the model. The shaded regions indicate when the learning rate is reduced by a certain factor, allowing for controlled and gradual convergence. The placement of these "switch" points is crucial for achieving optimal performance. The data suggests that the model benefits from a more aggressive learning rate reduction early in training, followed by finer adjustments later on.