\n
## Chart: Learning Rate Schedule
### Overview
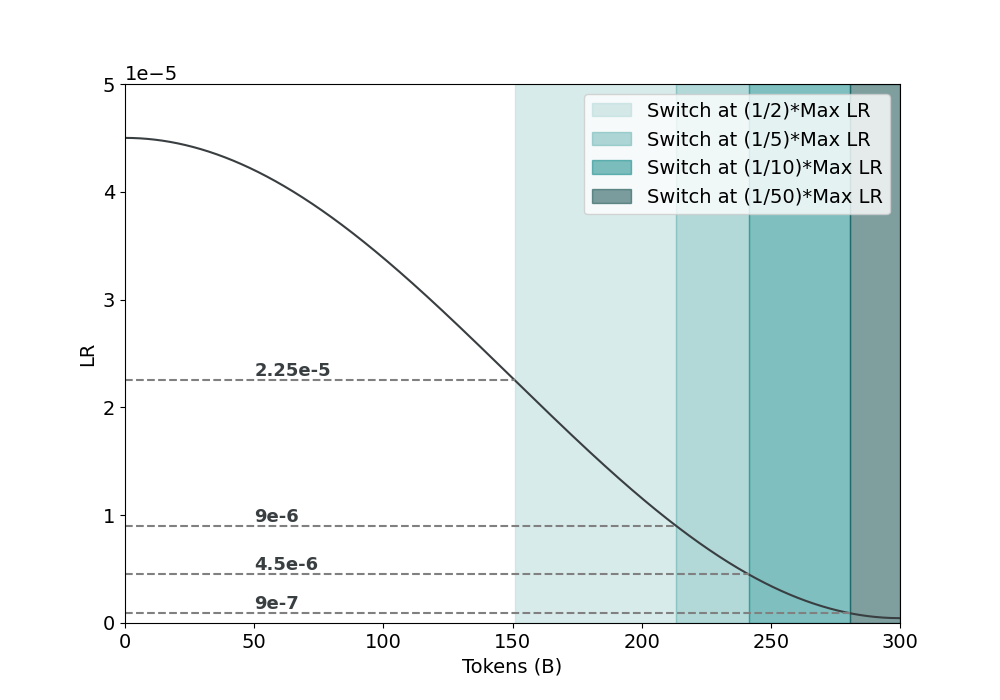
The image presents a chart illustrating a learning rate (LR) schedule as a function of tokens processed (in billions, denoted as 'B'). The chart depicts a decreasing learning rate over time, with shaded regions indicating different points at which the learning rate is reduced to a fraction of its maximum value.
### Components/Axes
* **X-axis:** Tokens (B) - Ranging from 0 to 300 (billions of tokens).
* **Y-axis:** LR (Learning Rate) - Ranging from 0 to 5e-5 (0 to 0.00005).
* **Data Series:** A single, solid black line representing the learning rate schedule.
* **Legend:** Located in the top-right corner, containing the following entries:
* "Switch at (1/2)\*Max LR" - Light blue shading
* "Switch at (1/5)\*Max LR" - Light teal shading
* "Switch at (1/10)\*Max LR" - Light grey shading
* "Switch at (1/50)\*Max LR" - Dark grey shading
* **Horizontal Lines:** Dashed horizontal lines indicating specific learning rate values: 2.25e-5, 9e-6, 4.5e-6, and 9e-7.
### Detailed Analysis
The black line representing the learning rate starts at approximately 4.5e-5 at 0 tokens and decreases smoothly towards 0 as the number of tokens increases.
* **Switch at (1/2)\*Max LR (Light Blue):** This region begins at approximately 100 tokens and extends to 300 tokens. The corresponding learning rate is approximately 2.25e-5.
* **Switch at (1/5)\*Max LR (Light Teal):** This region begins at approximately 175 tokens and extends to 300 tokens. The corresponding learning rate is approximately 9e-6.
* **Switch at (1/10)\*Max LR (Light Grey):** This region begins at approximately 225 tokens and extends to 300 tokens. The corresponding learning rate is approximately 4.5e-6.
* **Switch at (1/50)\*Max LR (Dark Grey):** This region begins at approximately 275 tokens and extends to 300 tokens. The corresponding learning rate is approximately 9e-7.
The learning rate decreases rapidly between 0 and 100 tokens, then more gradually between 100 and 300 tokens. The horizontal lines indicate the learning rate values at which the learning rate is switched to a lower fraction of its maximum value.
### Key Observations
* The learning rate schedule is designed to decrease the learning rate over time, which is a common practice in training deep learning models to improve convergence and prevent oscillations.
* The different shaded regions represent different strategies for reducing the learning rate.
* The learning rate is reduced to 1/2, 1/5, 1/10, and 1/50 of its maximum value at different token counts.
* The learning rate approaches zero as the number of tokens increases, indicating that the training process is slowing down.
### Interpretation
This chart demonstrates a learning rate decay schedule, a crucial component in training deep learning models. The schedule starts with a relatively high learning rate to allow for rapid initial progress, then gradually reduces the learning rate to fine-tune the model and prevent overshooting the optimal solution. The different shaded regions represent different points at which the learning rate is reduced, allowing for experimentation with different decay strategies. The choice of when to reduce the learning rate (i.e., the token count at which the switch occurs) can significantly impact the model's performance. The chart suggests that the model is trained for 300 billion tokens, and the learning rate is reduced multiple times during this process. The decreasing learning rate indicates a strategy to stabilize training and achieve better generalization. The horizontal lines provide specific learning rate thresholds for each decay step.