## Line Chart: Learning Rate Decay Schedule with Switch Points
### Overview
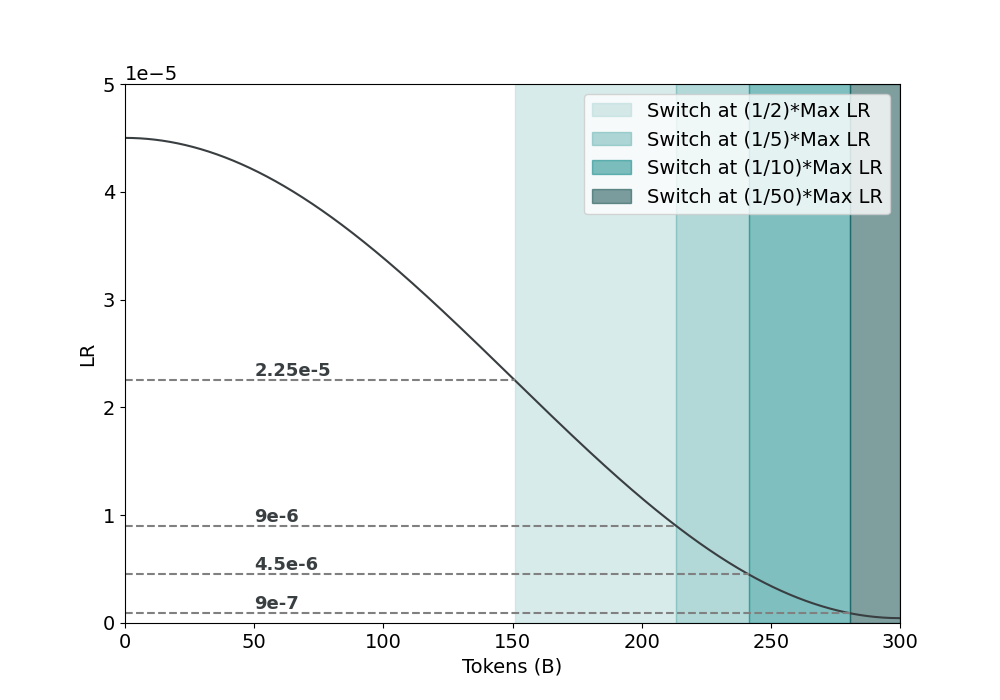
The image displays a line chart illustrating the decay of a learning rate (LR) over the course of training, measured in billions of tokens. The chart includes a primary decay curve and four shaded vertical regions that indicate specific points where the learning rate is switched to a fraction of its maximum value. The overall trend shows a smooth, monotonic decrease in the learning rate as training progresses.
### Components/Axes
* **X-Axis:** Labeled **"Tokens (B)"**, representing the number of training tokens in billions. The axis has major tick marks at intervals of 50, ranging from 0 to 300.
* **Y-Axis:** Labeled **"LR"** (Learning Rate). A multiplier **"1e-5"** is positioned at the top-left of the axis, indicating all y-axis values are scaled by 10⁻⁵. The axis has major tick marks at intervals of 1, ranging from 0 to 5 (representing 0 to 5e-5).
* **Legend:** Positioned in the **top-right corner** of the chart. It contains four entries, each associated with a distinct shade of teal, from lightest to darkest:
1. `Switch at (1/2)*Max LR` (Lightest teal)
2. `Switch at (1/5)*Max LR`
3. `Switch at (1/10)*Max LR`
4. `Switch at (1/50)*Max LR` (Darkest teal)
* **Data Series:** A single, solid black line representing the learning rate decay curve.
* **Reference Lines:** Four horizontal dashed lines extend from the y-axis across the chart, each labeled with a specific LR value:
* `2.25e-5`
* `9e-6`
* `4.5e-6`
* `9e-7`
* **Shaded Regions:** Four vertical bands, colored according to the legend, originate from the x-axis and extend upward to the decay curve. Their left edges align with the points where the decay curve intersects the corresponding horizontal dashed reference lines.
### Detailed Analysis
* **Decay Curve Trend:** The learning rate curve starts at its maximum value of approximately **4.5e-5** at 0 tokens. It follows a smooth, downward-sloping trajectory, with the rate of decay being steepest in the first half of the displayed range and gradually flattening as it approaches 300B tokens.
* **Switch Points & Shaded Regions:** The shaded regions mark the token counts at which the learning rate is reduced to a specific fraction of its maximum (4.5e-5). The alignment is precise:
* **Switch at (1/2)*Max LR (2.25e-5):** The lightest teal region begins at approximately **150B tokens**, where the decay curve crosses the `2.25e-5` reference line.
* **Switch at (1/5)*Max LR (9e-6):** The next darker region begins at approximately **210B tokens**, aligning with the `9e-6` reference line.
* **Switch at (1/10)*Max LR (4.5e-6):** The following region begins at approximately **240B tokens**, aligning with the `4.5e-6` reference line.
* **Switch at (1/50)*Max LR (9e-7):** The darkest region begins at approximately **280B tokens**, aligning with the `9e-7` reference line.
* **Data Point Extraction (Approximate):**
* At 0 tokens: LR ≈ 4.5e-5
* At 150B tokens: LR ≈ 2.25e-5 (Switch to 1/2 Max)
* At 210B tokens: LR ≈ 9e-6 (Switch to 1/5 Max)
* At 240B tokens: LR ≈ 4.5e-6 (Switch to 1/10 Max)
* At 280B tokens: LR ≈ 9e-7 (Switch to 1/50 Max)
* At 300B tokens: LR is slightly above 0, approaching the 9e-7 level.
### Key Observations
1. **Inverse Relationship:** There is a clear inverse relationship between training tokens and learning rate; as tokens increase, LR decreases.
2. **Non-Linear Decay:** The decay is not linear. The curve is convex, indicating the learning rate decreases more rapidly initially and then more slowly later in training.
3. **Staggered Switch Schedule:** The switch points are not evenly spaced in terms of token count. The gap between the first and second switch (~60B tokens) is larger than the gap between the third and fourth (~40B tokens), suggesting a schedule that becomes more aggressive in its reductions later in training.
4. **Visual Correlation:** The color intensity of the shaded regions directly correlates with the severity of the learning rate reduction (darker = smaller fraction of Max LR).
### Interpretation
This chart visualizes a **learning rate schedule with staged decay**, a common technique in training large machine learning models. The primary curve represents a continuous decay function (e.g., cosine decay). The shaded regions and legend indicate a secondary, discrete schedule where the learning rate is explicitly "switched" or reset to a predefined fraction of its initial maximum at specific token milestones.
The data suggests a training strategy designed for stability and fine-grained optimization. The initial high learning rate facilitates rapid learning. The staged reductions (to 1/2, then 1/5, etc.) likely correspond to phases where the model transitions from broad learning to refining its parameters, requiring smaller steps to converge effectively without overshooting. The fact that the switch points are triggered by the continuous decay curve reaching specific thresholds (the dashed lines) indicates an **adaptive schedule** where the discrete switches are synchronized with the continuous decay progress, rather than being fixed at arbitrary token counts. This approach ensures the learning rate reductions happen at points of comparable relative decay, potentially leading to more stable and effective training.