# Technical Document Extraction: Line Chart Analysis
## 1. Labels and Axis Titles
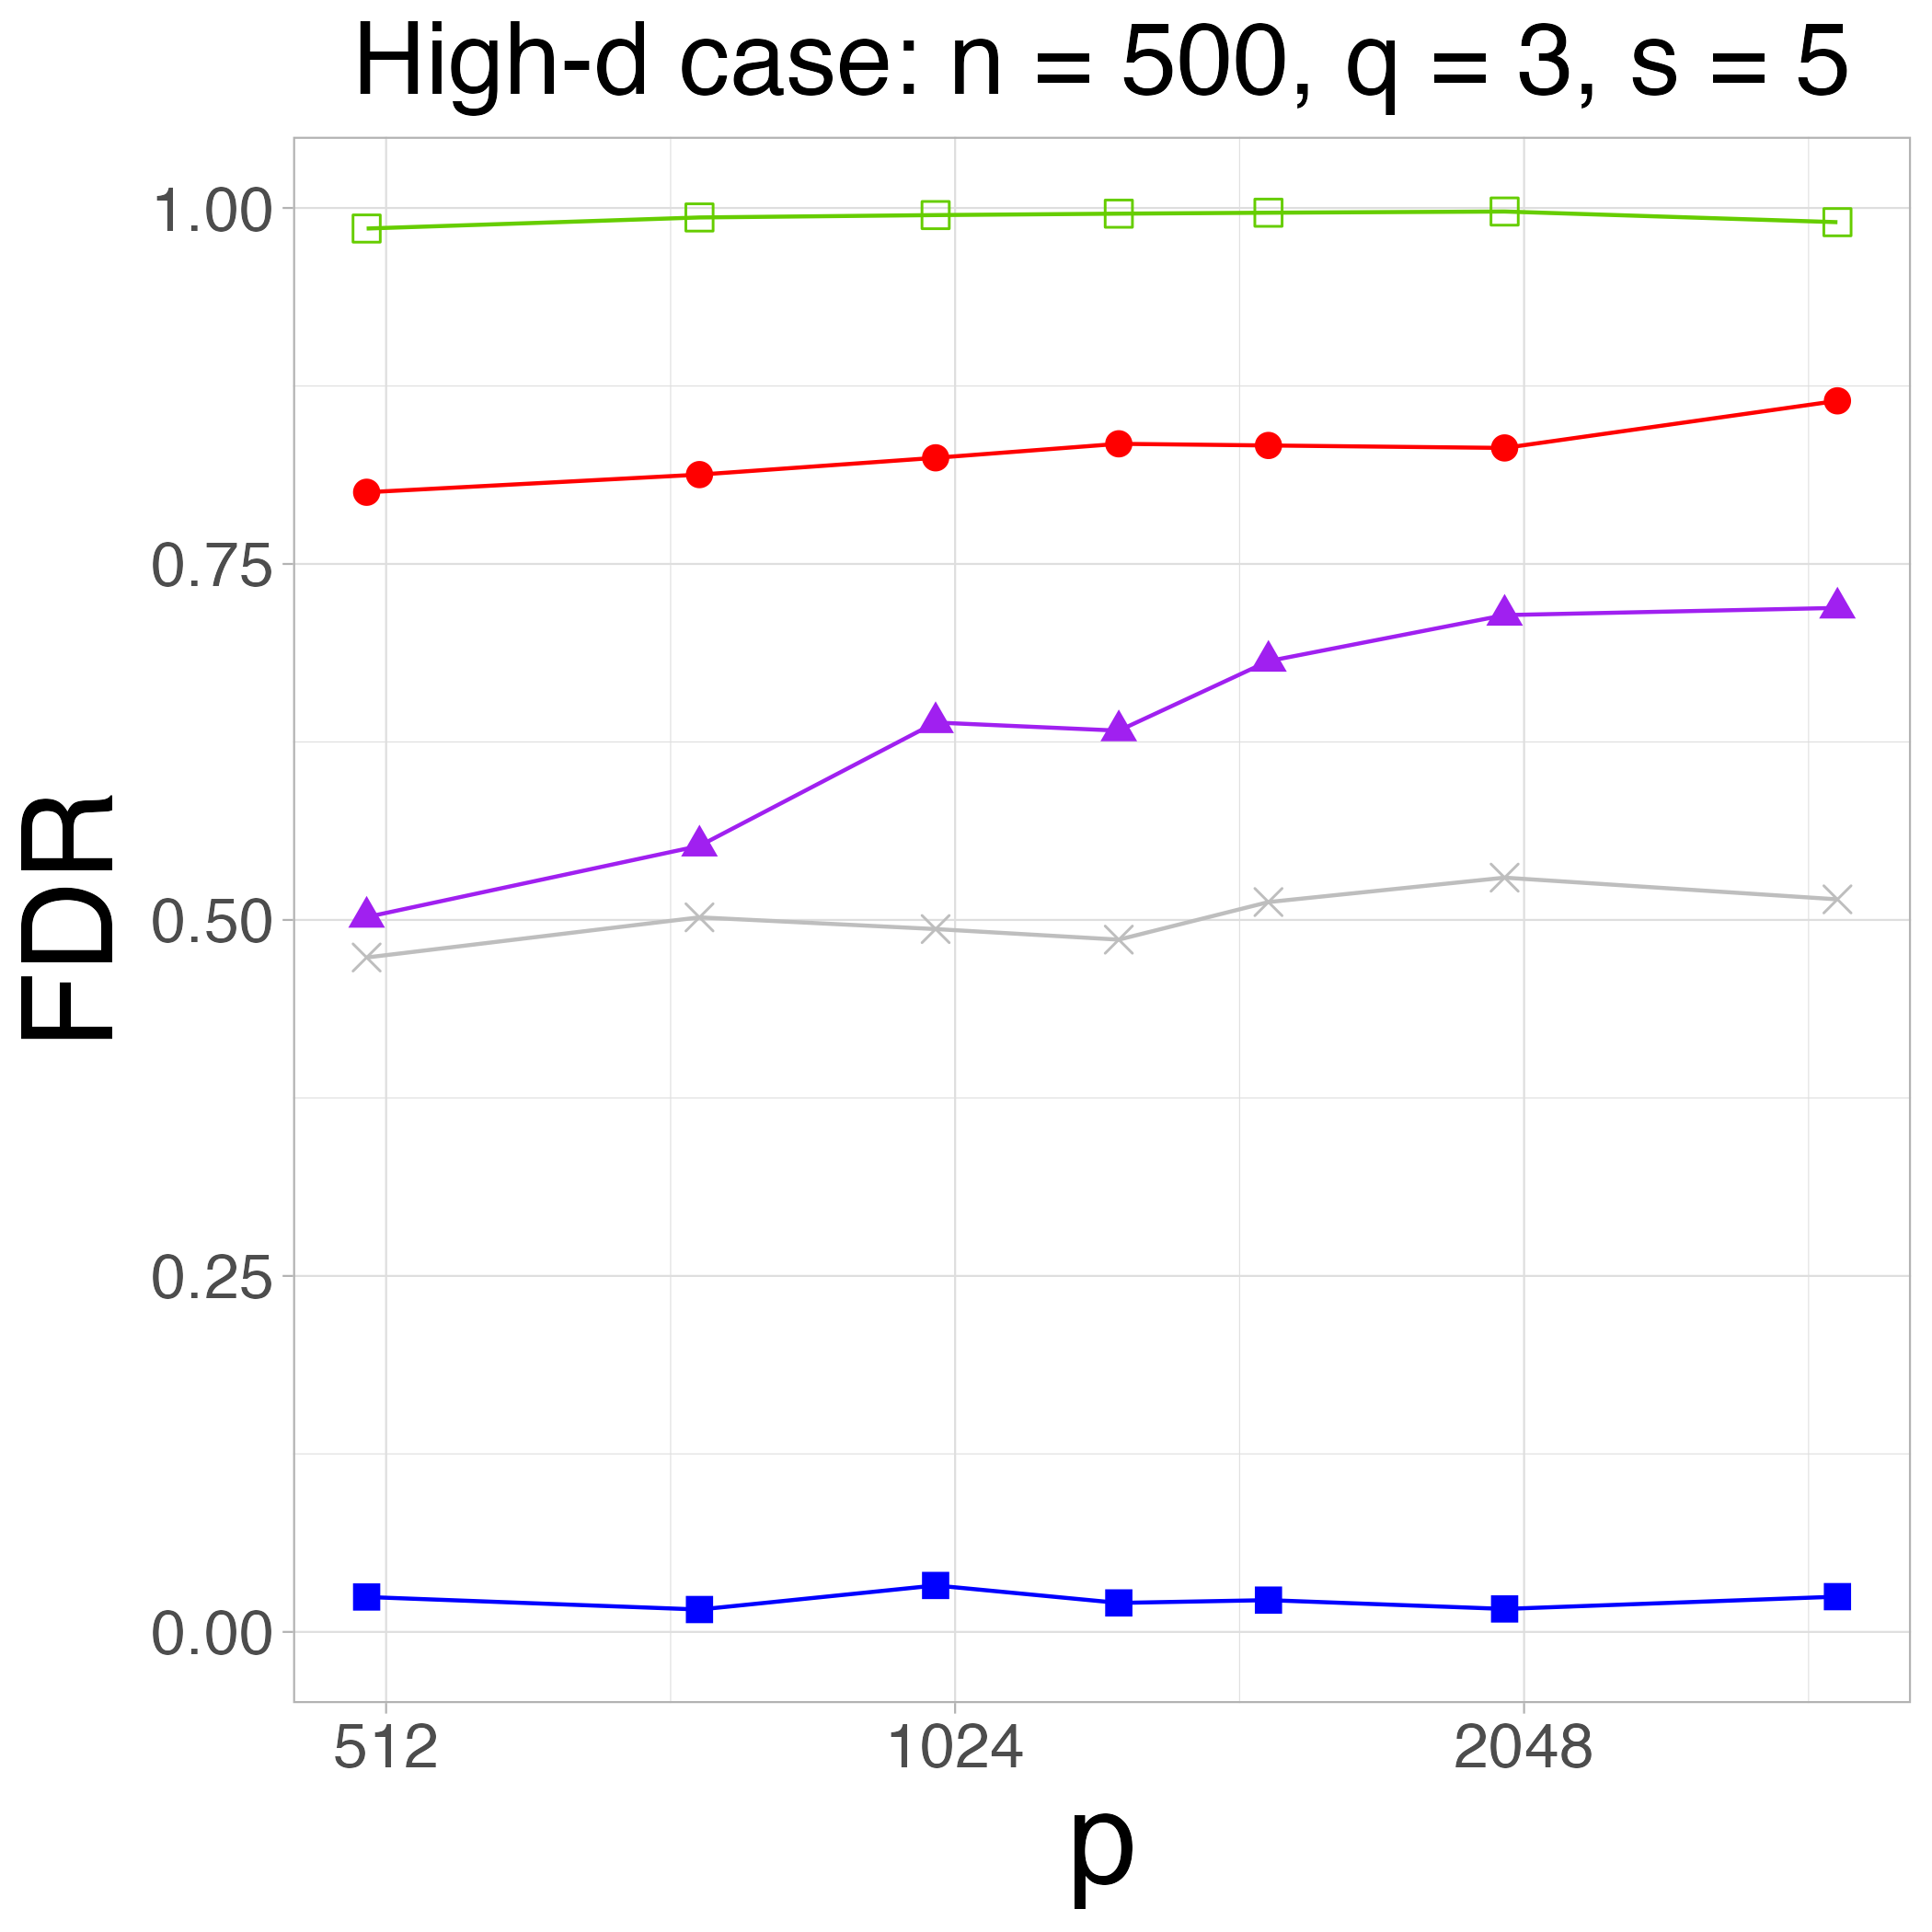
- **Title**: "High-d case: n = 500, q = 3, s = 5"
- **X-axis**: Labeled "p" (horizontal axis)
- **Y-axis**: Labeled "FDR" (vertical axis, range: 0.00 to 1.00)
## 2. Legend and Data Series
- **Legend Placement**: Top right (implied by color/marker mapping)
- **Data Series**:
- **Green Squares**: Flat line at ~1.00 (FDR)
- **Red Circles**: Slight upward trend from ~0.80 to ~0.90
- **Purple Triangles**: Peaks at ~0.70, then dips to ~0.65
- **Gray Crosses**: Stable at ~0.50
- **Blue Squares**: Near-zero line (~0.00)
## 3. Key Trends and Data Points
- **Green Line (Squares)**:
- **Trend**: Flat (no significant change)
- **Data Points**:
- p = 512: 1.00
- p = 1024: 1.00
- p = 2048: 1.00
- **Red Line (Circles)**:
- **Trend**: Gradual increase
- **Data Points**:
- p = 512: ~0.80
- p = 1024: ~0.85
- p = 2048: ~0.90
- **Purple Line (Triangles)**:
- **Trend**: Rises to peak, then declines
- **Data Points**:
- p = 512: ~0.50
- p = 1024: ~0.70
- p = 2048: ~0.65
- **Gray Line (Crosses)**:
- **Trend**: Stable
- **Data Points**:
- p = 512: ~0.50
- p = 1024: ~0.50
- p = 2048: ~0.50
- **Blue Line (Squares)**:
- **Trend**: Flat near zero
- **Data Points**:
- p = 512: ~0.00
- p = 1024: ~0.00
- p = 2048: ~0.00
## 4. Spatial Grounding
- **Legend**: Top right (no explicit box; inferred from color/marker mapping)
- **Axis Markers**:
- X-axis ticks at p = 512, 1024, 2048
- Y-axis ticks at 0.00, 0.25, 0.50, 0.75, 1.00
## 5. Component Isolation
- **Header**: Title and subtitle ("High-d case: n = 500, q = 3, s = 5")
- **Main Chart**: Four data series with distinct markers/colors
- **Footer**: No explicit footer; axis labels and ticks dominate lower regions
## 6. Cross-Reference Verification
- **Legend Colors vs. Line Colors**:
- Green squares match green line
- Red circles match red line
- Purple triangles match purple line
- Gray crosses match gray line
- Blue squares match blue line
## 7. Trend Verification
- **Green Line**: Confirmed flat (no deviation from 1.00)
- **Red Line**: Confirmed upward trend (0.80 → 0.90)
- **Purple Line**: Confirmed peak at 1024 (0.70) followed by decline
- **Gray Line**: Confirmed stable (~0.50)
- **Blue Line**: Confirmed near-zero (no visible deviation)
## 8. Data Table Reconstruction
| p | Green Squares | Red Circles | Purple Triangles | Gray Crosses | Blue Squares |
|------|---------------|-------------|------------------|--------------|--------------|
| 512 | 1.00 | ~0.80 | ~0.50 | ~0.50 | ~0.00 |
| 1024 | 1.00 | ~0.85 | ~0.70 | ~0.50 | ~0.00 |
| 2048 | 1.00 | ~0.90 | ~0.65 | ~0.50 | ~0.00 |
## 9. Additional Notes
- **No Other Languages**: All text is in English.
- **No Embedded Diagrams/Tables**: Chart contains only line plots.
- **No Missing Data**: All series have values at all p points.