## Scatter Plot: Model Footprint vs. $R^2$ Performance
### Overview
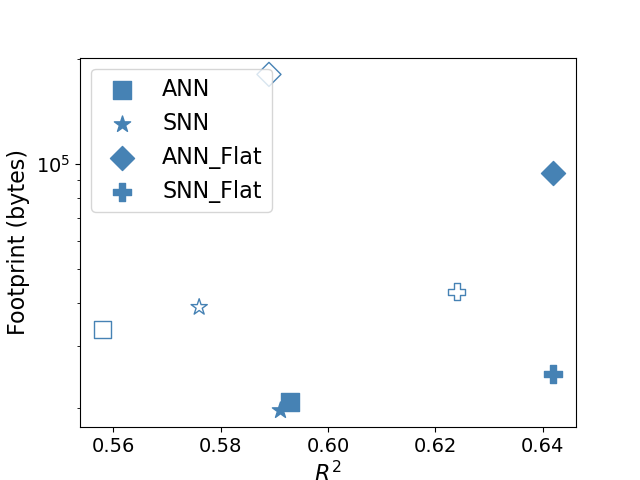
This image is a scatter plot comparing the memory "Footprint (bytes)" on the Y-axis against the "$R^2$" (coefficient of determination) on the X-axis for four distinct model types. The plot utilizes a logarithmic scale for the Y-axis. There is an unexplained distinction between hollow and filled markers for each category, which is not defined in the provided legend.
### Components/Axes
* **Y-Axis:** Labeled "Footprint (bytes)". The scale is logarithmic, with a visible tick mark at $10^5$.
* **X-Axis:** Labeled "$R^2$". The scale ranges from 0.56 to 0.64.
* **Legend (Located in the top-left quadrant):**
* **Square:** ANN
* **Star:** SNN
* **Diamond:** ANN_Flat
* **Plus:** SNN_Flat
### Detailed Analysis
The plot contains eight data points in total, consisting of four categories, each represented by both a hollow and a filled marker.
| Category | Marker Type | Approx. $R^2$ (X) | Approx. Footprint (Y) |
| :--- | :--- | :--- | :--- |
| **ANN** | Hollow Square | 0.56 | $3 \times 10^4$ |
| **ANN** | Filled Square | 0.595 | $2 \times 10^4$ |
| **SNN** | Hollow Star | 0.575 | $3.5 \times 10^4$ |
| **SNN** | Filled Star | 0.59 | $1.8 \times 10^4$ |
| **ANN_Flat** | Hollow Diamond | 0.59 | $4 \times 10^5$ |
| **ANN_Flat** | Filled Diamond | 0.64 | $9 \times 10^4$ |
| **SNN_Flat** | Hollow Plus | 0.625 | $4 \times 10^4$ |
| **SNN_Flat** | Filled Plus | 0.64 | $2.5 \times 10^4$ |
*Note: Y-axis values are estimated based on the logarithmic scale relative to the $10^5$ marker.*
### Key Observations
* **Performance Clustering:** The "Flat" variants (ANN_Flat and SNN_Flat) consistently achieve higher $R^2$ values (ranging from ~0.59 to 0.64) compared to the standard ANN and SNN models (ranging from ~0.56 to 0.595).
* **Outlier:** The hollow diamond (ANN_Flat) is a significant outlier in terms of memory usage, with a footprint significantly higher than all other data points ($>10^5$ bytes).
* **Efficiency:** The filled SNN_Flat marker represents a highly efficient model, achieving the highest $R^2$ ($\approx 0.64$) while maintaining a relatively low footprint ($\approx 2.5 \times 10^4$ bytes).
* **Marker Discrepancy:** The legend does not define the difference between hollow and filled markers. However, across all categories, the filled markers generally show a lower footprint than their hollow counterparts (with the exception of the ANN_Flat, where the filled marker is lower, but the hollow marker is an extreme outlier).
### Interpretation
This data demonstrates a trade-off analysis between model complexity (footprint) and predictive accuracy ($R^2$).
1. **Optimization Impact:** The "Flat" architecture appears to be a superior design choice for maximizing $R^2$, as both ANN_Flat and SNN_Flat occupy the right side of the X-axis.
2. **Efficiency:** The SNN_Flat model appears to be the most desirable configuration. It achieves the same peak $R^2$ as the ANN_Flat (filled) but does so with a significantly smaller memory footprint (roughly 1/4th the size of the filled ANN_Flat).
3. **Experimental Conditions:** The presence of both hollow and filled markers suggests two different experimental conditions (e.g., "Baseline" vs. "Optimized" or "Training" vs. "Inference"). The consistent shift in the filled markers suggests that the second condition generally results in a lower memory footprint across all model types.