# Technical Document Analysis of Scatter Plot
## Chart Overview
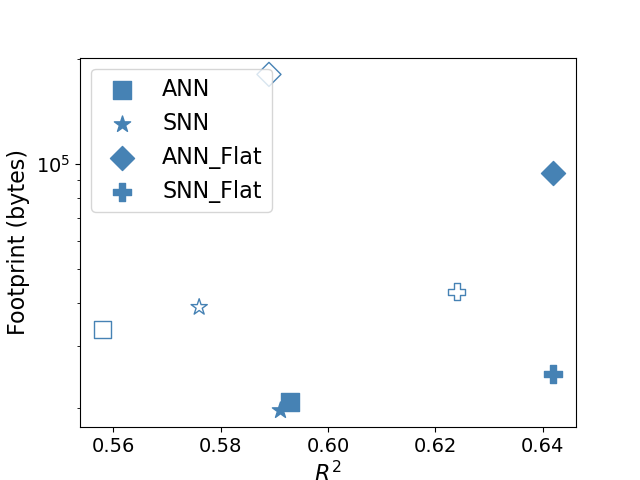
The image is a **scatter plot** comparing **footprint (bytes)** against **R²** values for four distinct models. The plot uses a **logarithmic scale** for the y-axis (footprint) and a **linear scale** for the x-axis (R²). No gridlines or background elements are present.
---
## Legend
- **Location**: Top-left corner of the plot.
- **Labels and Symbols**:
- `ANN`: Blue square (`■`)
- `SNN`: Blue star (`★`)
- `ANN_Flat`: Blue diamond (`◇`)
- `SNN_Flat`: Blue plus (`✞`)
- **Color Consistency**: All symbols are rendered in **blue**, matching the legend.
---
## Axes
- **X-axis (R²)**:
- Range: `0.56` to `0.64`
- Ticks: `0.56`, `0.58`, `0.60`, `0.62`, `0.64`
- Label: `R²`
- **Y-axis (Footprint (bytes))**:
- Scale: Logarithmic (`10⁵` to `10⁶`)
- Ticks: `10⁵` (100,000)
- Label: `Footprint (bytes)`
---
## Data Points
### 1. ANN (Blue Square `■`)
- **Points**:
- `(0.56, ~10⁵)`: Located at the far-left x-axis, near the bottom y-axis.
- `(0.59, ~10⁵)`: Slightly right of `0.56`, same y-axis level.
### 2. SNN (Blue Star `★`)
- **Points**:
- `(0.58, ~10⁵)`: Mid-left x-axis, bottom y-axis.
- `(0.59, ~10⁵)`: Overlaps with ANN’s second point.
- `(0.63, ~10⁵)`: Far-right x-axis, bottom y-axis.
### 3. ANN_Flat (Blue Diamond `◇`)
- **Points**:
- `(0.64, ~10⁵.⁵)`: Far-right x-axis, y-axis ~316,228 bytes (10⁵.⁵ ≈ 316,228).
### 4. SNN_Flat (Blue Plus `✞`)
- **Points**:
- `(0.60, ~10⁵)`: Mid x-axis, bottom y-axis.
- `(0.63, ~10⁵)`: Overlaps with SNN’s third point.
---
## Trends
1. **ANN and SNN**:
- Lower footprint (`~10⁵` bytes) with moderate R² (`0.56–0.63`).
- SNN shows slightly higher R² than ANN for similar footprint.
2. **ANN_Flat and SNN_Flat**:
- Higher footprint (`~10⁵.⁵` bytes for ANN_Flat) with higher R² (`0.64`).
- SNN_Flat achieves high R² (`0.63`) with minimal footprint increase.
3. **Trade-off**:
- Flat models (`ANN_Flat`, `SNN_Flat`) sacrifice footprint for improved R² compared to their non-flat counterparts.
---
## Spatial Grounding
- **Legend**: Top-left corner (standard placement).
- **Data Point Accuracy**:
- All symbols match legend labels (e.g., `◇` = `ANN_Flat`).
- No mismatches between symbol type and legend entry.
---
## Additional Notes
- **No Text Blocks**: The image contains no standalone text outside the legend and axis labels.
- **Sparse Data**: Only 7 data points are plotted, with no overlapping symbols beyond intentional overlaps (e.g., SNN and ANN at `(0.59, ~10⁵)`).
- **Logarithmic Scale**: Y-axis values are exponential, emphasizing differences in footprint magnitude.
---
## Conclusion
The plot highlights a trade-off between model complexity (footprint) and performance (R²). Flat models (`ANN_Flat`, `SNN_Flat`) achieve higher R² at the cost of increased footprint, while non-flat models (`ANN`, `SNN`) prioritize efficiency with lower footprint but slightly lower R².