## Box Plot: Steps vs. Food Patch by Model Variant
### Overview
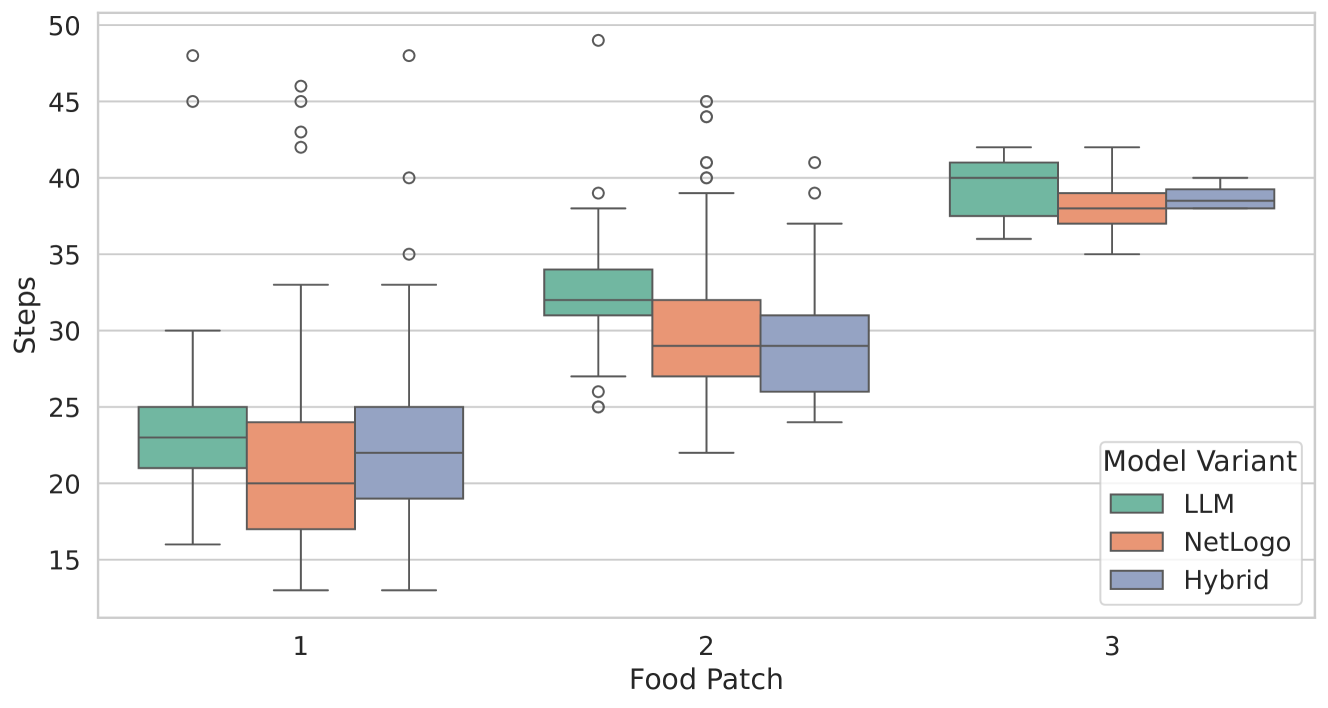
The image is a box plot comparing the number of steps taken by three different model variants (LLM, NetLogo, and Hybrid) across three different food patch scenarios (1, 2, and 3). The y-axis represents the number of steps, and the x-axis represents the food patch. The box plot visually summarizes the distribution of steps for each model variant at each food patch, showing the median, quartiles, and outliers.
### Components/Axes
* **Title:** Implicit, but the chart compares "Steps" vs "Food Patch" by "Model Variant"
* **X-axis:** "Food Patch" with categories 1, 2, and 3.
* **Y-axis:** "Steps" with a numerical scale ranging from 15 to 50, with tick marks at intervals of 5.
* **Legend:** Located in the bottom-right corner, indicating the model variants:
* LLM (light green)
* NetLogo (light orange)
* Hybrid (light blue/grey)
### Detailed Analysis
**Food Patch 1:**
* **LLM (light green):** The box extends from approximately 21 to 25 steps, with a median around 23 steps. The lower whisker extends down to approximately 16 steps, and the upper whisker extends to approximately 30 steps. There are two outliers at approximately 45 and 48 steps.
* **NetLogo (light orange):** The box extends from approximately 18 to 24 steps, with a median around 20 steps. The lower whisker extends down to approximately 13 steps, and the upper whisker extends to approximately 33 steps. There are two outliers at approximately 43 and 45 steps.
* **Hybrid (light blue/grey):** The box extends from approximately 19 to 25 steps, with a median around 22 steps. The lower whisker extends down to approximately 13 steps, and the upper whisker extends to approximately 30 steps. There is one outlier at approximately 49 steps.
**Food Patch 2:**
* **LLM (light green):** The box extends from approximately 31 to 34 steps, with a median around 33 steps. The lower whisker extends down to approximately 26 steps, and the upper whisker extends to approximately 39 steps. There are two outliers at approximately 26 and 49 steps.
* **NetLogo (light orange):** The box extends from approximately 28 to 32 steps, with a median around 30 steps. The lower whisker extends down to approximately 23 steps, and the upper whisker extends to approximately 37 steps. There are two outliers at approximately 41 and 45 steps.
* **Hybrid (light blue/grey):** The box extends from approximately 27 to 31 steps, with a median around 29 steps. The lower whisker extends down to approximately 24 steps, and the upper whisker extends to approximately 37 steps. There is one outlier at approximately 40 steps.
**Food Patch 3:**
* **LLM (light green):** The box extends from approximately 38 to 41 steps, with a median around 40 steps. The lower whisker extends down to approximately 37 steps, and the upper whisker extends to approximately 42 steps.
* **NetLogo (light orange):** The box extends from approximately 37 to 39 steps, with a median around 38 steps. The lower whisker extends down to approximately 35 steps, and the upper whisker extends to approximately 42 steps.
* **Hybrid (light blue/grey):** The box extends from approximately 38 to 40 steps, with a median around 39 steps. The lower whisker extends down to approximately 37 steps, and the upper whisker extends to approximately 42 steps.
### Key Observations
* Across all food patches, the number of steps generally increases from Food Patch 1 to Food Patch 3.
* For Food Patch 1, the LLM model has a slightly higher median number of steps compared to NetLogo and Hybrid.
* For Food Patch 2, the LLM model has a slightly higher median number of steps compared to NetLogo and Hybrid.
* For Food Patch 3, the LLM, NetLogo, and Hybrid models have similar median number of steps.
* The number of outliers decreases as the food patch number increases.
### Interpretation
The box plot suggests that as the food patch number increases, the number of steps required by all three model variants generally increases. This could indicate that the complexity or distance to the food source increases with the food patch number. The LLM model tends to have a slightly higher median number of steps compared to NetLogo and Hybrid for Food Patches 1 and 2, but the models converge for Food Patch 3. The presence of outliers in Food Patch 1 and 2 suggests that there are instances where the models take significantly more steps than usual, possibly due to getting stuck or taking a less efficient path. The decrease in outliers for Food Patch 3 could indicate that the models are more consistent in their performance as the food patch number increases.