\n
## Box Plot: Steps vs. Food Patch for Different Model Variants
### Overview
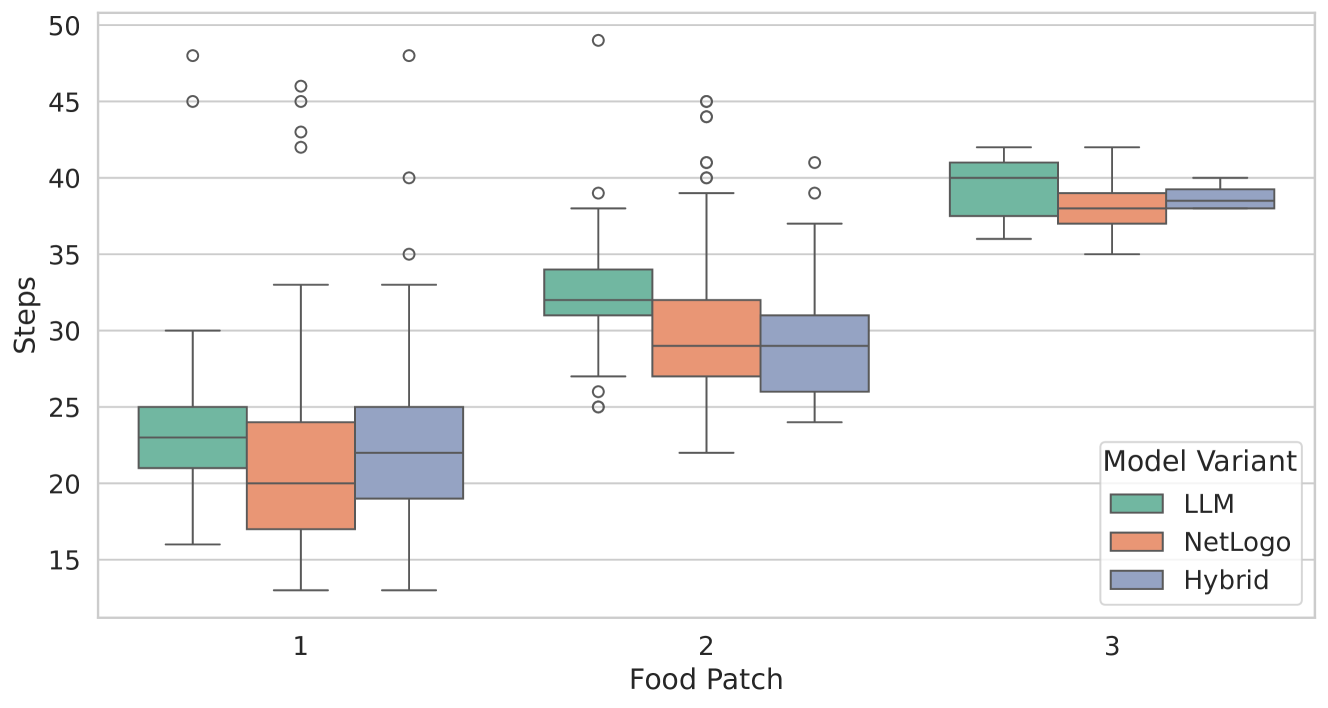
The image presents a box plot comparing the number of "Steps" taken by three different "Model Variants" (LLM, NetLogo, and Hybrid) across three different "Food Patch" configurations (1, 2, and 3). The plot visualizes the distribution of steps for each combination of model variant and food patch, showing the median, quartiles, and outliers.
### Components/Axes
* **X-axis:** "Food Patch" with values 1, 2, and 3.
* **Y-axis:** "Steps" with a scale ranging from approximately 15 to 50.
* **Legend (top-right):** "Model Variant" with three categories:
* LLM (represented by a light green color)
* NetLogo (represented by a light orange color)
* Hybrid (represented by a light blue/purple color)
* **Data Points:** Box plots representing the distribution of steps for each combination of Food Patch and Model Variant. Outliers are represented by individual circles ("o").
### Detailed Analysis
Let's analyze each Food Patch configuration separately:
**Food Patch 1:**
* **LLM (Green):** Median is approximately 22 steps. The box extends from roughly 18 to 28 steps. There are several outliers above 40 steps.
* **NetLogo (Orange):** Median is approximately 24 steps. The box extends from roughly 20 to 30 steps. There are outliers above 40 steps.
* **Hybrid (Blue):** Median is approximately 24 steps. The box extends from roughly 20 to 30 steps. There are outliers above 40 steps.
**Food Patch 2:**
* **LLM (Green):** Median is approximately 32 steps. The box extends from roughly 28 to 38 steps. There are outliers above 40 steps.
* **NetLogo (Orange):** Median is approximately 30 steps. The box extends from roughly 25 to 36 steps. There are outliers above 40 steps.
* **Hybrid (Blue):** Median is approximately 28 steps. The box extends from roughly 24 to 34 steps. There are outliers above 40 steps.
**Food Patch 3:**
* **LLM (Green):** Median is approximately 38 steps. The box extends from roughly 34 to 42 steps. There are few outliers.
* **NetLogo (Orange):** Median is approximately 36 steps. The box extends from roughly 32 to 40 steps. There are few outliers.
* **Hybrid (Blue):** Median is approximately 38 steps. The box extends from roughly 34 to 42 steps. There are few outliers.
### Key Observations
* The number of steps generally increases as the Food Patch number increases.
* For Food Patch 1, the three model variants have similar distributions of steps.
* For Food Patch 2 and 3, the distributions are still relatively similar, but the LLM variant tends to have a slightly higher median number of steps.
* Outliers are more prevalent in Food Patch 1 and 2 than in Food Patch 3.
* The interquartile range (IQR) appears to be relatively consistent across the different model variants for each food patch.
### Interpretation
The data suggests that the complexity of the food patch environment (as indicated by the Food Patch number) influences the number of steps taken by the models. As the food patch becomes more complex (higher number), the models generally require more steps to complete their task. The LLM model consistently shows a slightly higher median number of steps compared to NetLogo and Hybrid, particularly in the more complex food patch environments (2 and 3). This could indicate that the LLM model explores the environment more thoroughly or takes a different approach to finding food. The presence of outliers suggests that there is variability in the performance of the models, and some runs may require significantly more steps than others. The reduction in outliers in Food Patch 3 could indicate that the models converge to more consistent behaviors in simpler environments. The similar distributions across the three model variants suggest that they are all capable of solving the task, but may differ in their efficiency or strategy.