## Box Plot Chart: Model Variant Performance Across Food Patches
### Overview
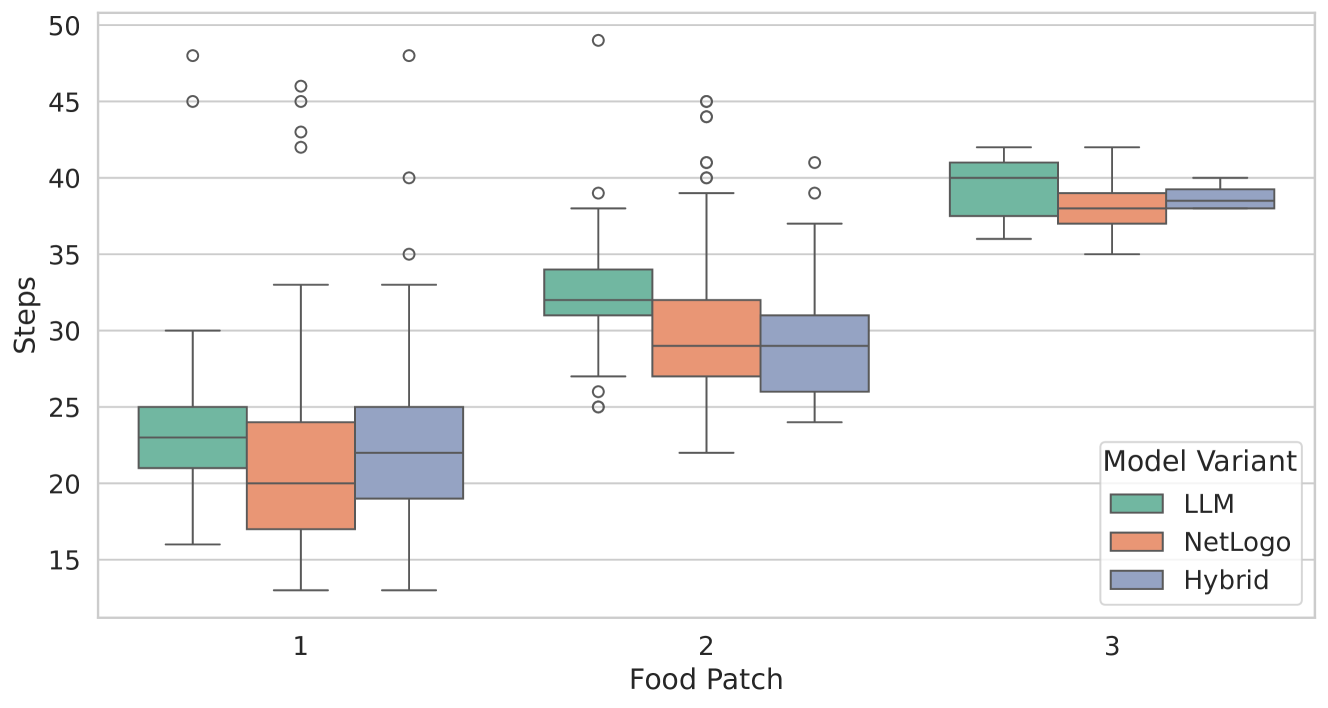
The image is a grouped box plot chart comparing the performance (measured in "Steps") of three different model variants across three sequential "Food Patches." The chart visualizes the distribution of step counts for each model within each patch, including medians, quartiles, ranges, and outliers.
### Components/Axes
* **Chart Type:** Grouped Box Plot.
* **Y-Axis:** Labeled **"Steps"**. The scale runs from 15 to 50, with major gridlines at intervals of 5 (15, 20, 25, 30, 35, 40, 45, 50).
* **X-Axis:** Labeled **"Food Patch"**. It contains three discrete categories: **1**, **2**, and **3**.
* **Legend:** Located in the **bottom-right corner** of the chart area. It is titled **"Model Variant"** and defines three categories with corresponding colors:
* **LLM:** Green/Teal box.
* **NetLogo:** Orange/Salmon box.
* **Hybrid:** Blue/Grey box.
* **Data Representation:** For each Food Patch (1, 2, 3), there are three adjacent box plots, one for each model variant (LLM, NetLogo, Hybrid), ordered left-to-right as per the legend.
### Detailed Analysis
**Food Patch 1:**
* **LLM (Green):** Median ≈ 23 steps. Interquartile Range (IQR) ≈ 21 to 25 steps. Whiskers extend from ≈16 to ≈30 steps. Several outliers are present above the upper whisker, at approximately 45, 48, and 49 steps.
* **NetLogo (Orange):** Median ≈ 20 steps. IQR ≈ 17 to 24 steps. Whiskers extend from ≈13 to ≈33 steps. Outliers are present at ≈42, 43, 45, and 46 steps.
* **Hybrid (Blue):** Median ≈ 22 steps. IQR ≈ 19 to 25 steps. Whiskers extend from ≈13 to ≈33 steps. Outliers are present at ≈35, 40, and 48 steps.
* **Trend:** All models show their lowest median step counts in this patch. The distributions are relatively wide, with significant overlap between models. NetLogo has the lowest median.
**Food Patch 2:**
* **LLM (Green):** Median ≈ 32 steps. IQR ≈ 31 to 34 steps. Whiskers extend from ≈27 to ≈38 steps. Outliers are present at ≈25, 26, 39, and 49 steps.
* **NetLogo (Orange):** Median ≈ 29 steps. IQR ≈ 27 to 32 steps. Whiskers extend from ≈22 to ≈39 steps. Outliers are present at ≈40, 41, 44, and 45 steps.
* **Hybrid (Blue):** Median ≈ 29 steps. IQR ≈ 26 to 31 steps. Whiskers extend from ≈24 to ≈37 steps. Outliers are present at ≈39 and ≈41 steps.
* **Trend:** A clear increase in median steps for all models compared to Patch 1. The LLM model's median is now distinctly higher than the other two. The spread (IQR) for LLM appears slightly tighter.
**Food Patch 3:**
* **LLM (Green):** Median ≈ 40 steps. IQR ≈ 37 to 41 steps. Whiskers extend from ≈36 to ≈42 steps. No visible outliers.
* **NetLogo (Orange):** Median ≈ 38 steps. IQR ≈ 37 to 39 steps. Whiskers extend from ≈35 to ≈42 steps. No visible outliers.
* **Hybrid (Blue):** Median ≈ 39 steps. IQR ≈ 38 to 39 steps. Whiskers extend from ≈38 to ≈40 steps. No visible outliers.
* **Trend:** All models show their highest median step counts. The distributions are much tighter (smaller IQR and range) compared to Patches 1 and 2, and no outliers are present. The performance of all three models converges, with very similar medians and ranges.
### Key Observations
1. **Monotonic Increase:** There is a clear, consistent trend where the median number of steps required increases for all model variants as the Food Patch number increases from 1 to 3.
2. **Convergence of Performance:** The variability in step counts (spread of the box and whiskers) decreases dramatically from Patch 1 to Patch 3. By Patch 3, the performance of all three models is very similar and tightly clustered.
3. **Outlier Pattern:** Outliers (extreme high step counts) are frequent in Patches 1 and 2 but are absent in Patch 3. This suggests that difficult or anomalous cases occur in the earlier patches but not in the final one.
4. **Relative Model Performance:** In Patch 1, NetLogo has the lowest median. In Patch 2, LLM has the highest median. By Patch 3, all medians are within approximately 2 steps of each other.
### Interpretation
This chart likely presents results from a simulation or experiment where agents (controlled by different models) must complete tasks across a series of environments or stages ("Food Patches"). The "Steps" metric is a measure of effort, time, or cost.
* **Increasing Difficulty:** The steady rise in steps from Patch 1 to 3 strongly suggests that each subsequent patch presents a greater challenge, requiring more actions to complete. This could be due to increased distance, complexity, or scarcity.
* **Model Behavior Under Pressure:** The LLM model appears to be the most affected by the increasing difficulty in the middle stage (Patch 2), showing the highest median steps. However, in the final, most demanding stage (Patch 3), all models perform similarly, suggesting a performance ceiling or a convergence in strategy when faced with maximum difficulty.
* **Stability vs. Variability:** The high number of outliers in earlier patches indicates that all models occasionally encounter scenarios that require drastically more steps. The absence of outliers in Patch 3 implies that the task there, while harder, is more consistent or predictable, leading to more uniform performance.
* **Peircean Insight:** The data pattern (increasing central tendency, decreasing variance) is a classic signature of a system approaching a limit or a well-defined, constrained problem space. The initial variability reflects exploration or diverse strategies, while the final convergence indicates that the problem's structure in Patch 3 dictates a narrow range of possible solutions, regardless of the model's underlying approach (LLM, rule-based NetLogo, or Hybrid).