## Box Plot: Steps Required by Model Variants Across Food Patches
### Overview
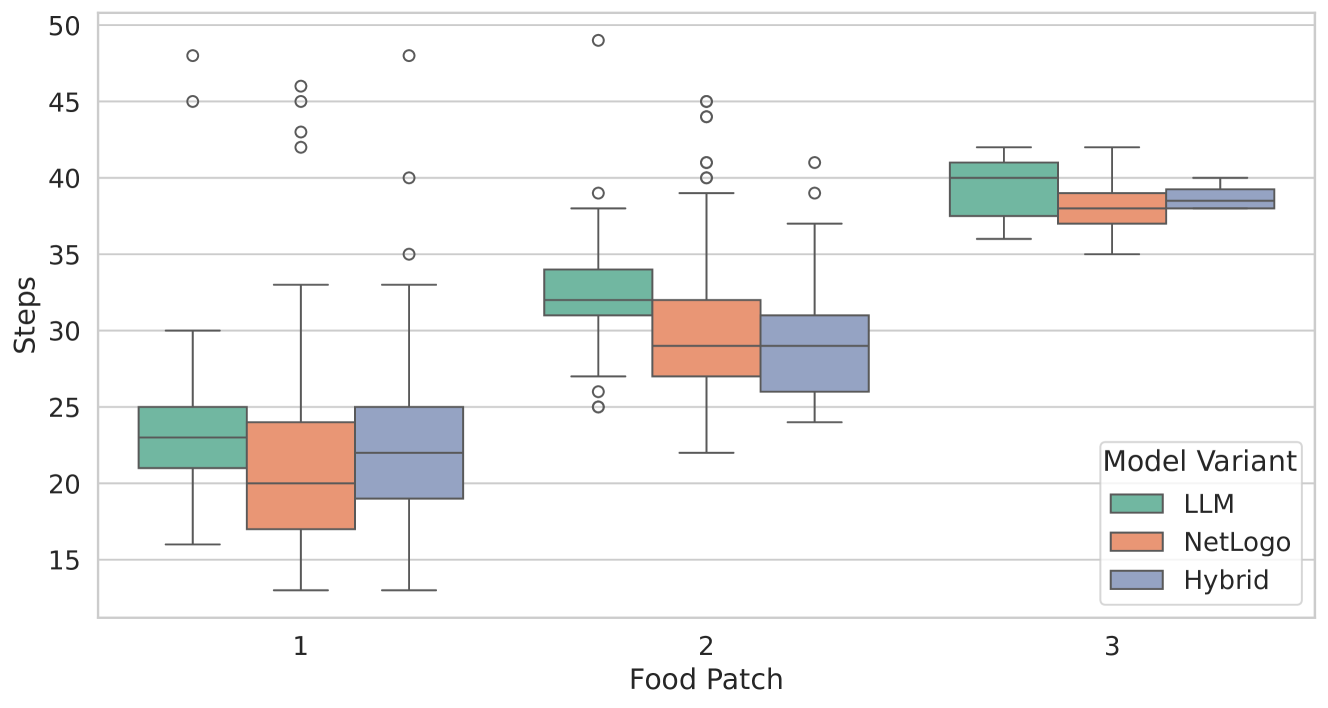
The image displays a comparative box plot analysis of three computational models (LLM, NetLogo, Hybrid) across three food patch scenarios (1, 2, 3). The y-axis measures "Steps" (15–50), while the x-axis categorizes data by food patch. Each model variant is represented by distinct colors: green (LLM), orange (NetLogo), and blue (Hybrid). Outliers are marked as individual dots beyond whisker ranges.
### Components/Axes
- **X-axis (Food Patch)**: Categorical scale with three discrete values (1, 2, 3).
- **Y-axis (Steps)**: Numerical scale from 15 to 50, incremented by 5.
- **Legend**: Positioned at bottom-right, mapping colors to model variants:
- Green = LLM
- Orange = NetLogo
- Blue = Hybrid
- **Box Plot Elements**:
- Median line (bold horizontal line within each box)
- Interquartile range (IQR) (box boundaries)
- Whiskers (extending to 1.5×IQR)
- Outliers (dots beyond whiskers)
### Detailed Analysis
#### Food Patch 1
- **LLM (Green)**:
- Median: ~22 steps
- IQR: 20–25 steps
- Range: 15–30 steps
- Outliers: 1 dot at ~48 steps
- **NetLogo (Orange)**:
- Median: ~20 steps
- IQR: 18–24 steps
- Range: 14–32 steps
- **Hybrid (Blue)**:
- Median: ~23 steps
- IQR: 21–25 steps
- Range: 18–34 steps
#### Food Patch 2
- **LLM (Green)**:
- Median: ~32 steps
- IQR: 30–35 steps
- Range: 25–40 steps
- Outliers: 1 dot at ~49 steps
- **NetLogo (Orange)**:
- Median: ~30 steps
- IQR: 28–33 steps
- Range: 24–38 steps
- **Hybrid (Blue)**:
- Median: ~31 steps
- IQR: 27–32 steps
- Range: 23–39 steps
#### Food Patch 3
- **LLM (Green)**:
- Median: ~40 steps
- IQR: 38–42 steps
- Range: 36–44 steps
- **NetLogo (Orange)**:
- Median: ~38 steps
- IQR: 36–40 steps
- Range: 34–43 steps
- **Hybrid (Blue)**:
- Median: ~39 steps
- IQR: 37–41 steps
- Range: 35–42 steps
### Key Observations
1. **Model Performance Trends**:
- LLM shows the highest median steps in Patch 3 (~40), while NetLogo has the lowest median in Patch 1 (~20).
- Hybrid consistently exhibits intermediate performance across all patches.
2. **Variability**:
- LLM demonstrates the greatest range in Patch 1 (15–30 steps) and the fewest outliers.
- NetLogo has the most outliers in Patch 1 (1 dot at ~48 steps).
3. **Outlier Patterns**:
- LLM and NetLogo each have 1 outlier in Patch 1.
- Hybrid has no outliers in Patch 3.
### Interpretation
The data suggests that model efficiency varies significantly by food patch configuration. LLM performs best in Patch 3 but shows high variability in Patch 1, potentially indicating sensitivity to initial conditions. NetLogo’s lower median in Patch 1 implies superior efficiency in simpler scenarios, while its outlier in Patch 1 (48 steps) may reflect edge-case failures. Hybrid maintains consistent mid-tier performance, suggesting robustness across configurations. The absence of outliers in Hybrid’s Patch 3 data implies stable behavior under optimal conditions. These trends could inform model selection based on environmental complexity and reliability requirements.