## Stacked Area Chart: Number of Packages Over Time (2018–2023)
### Overview
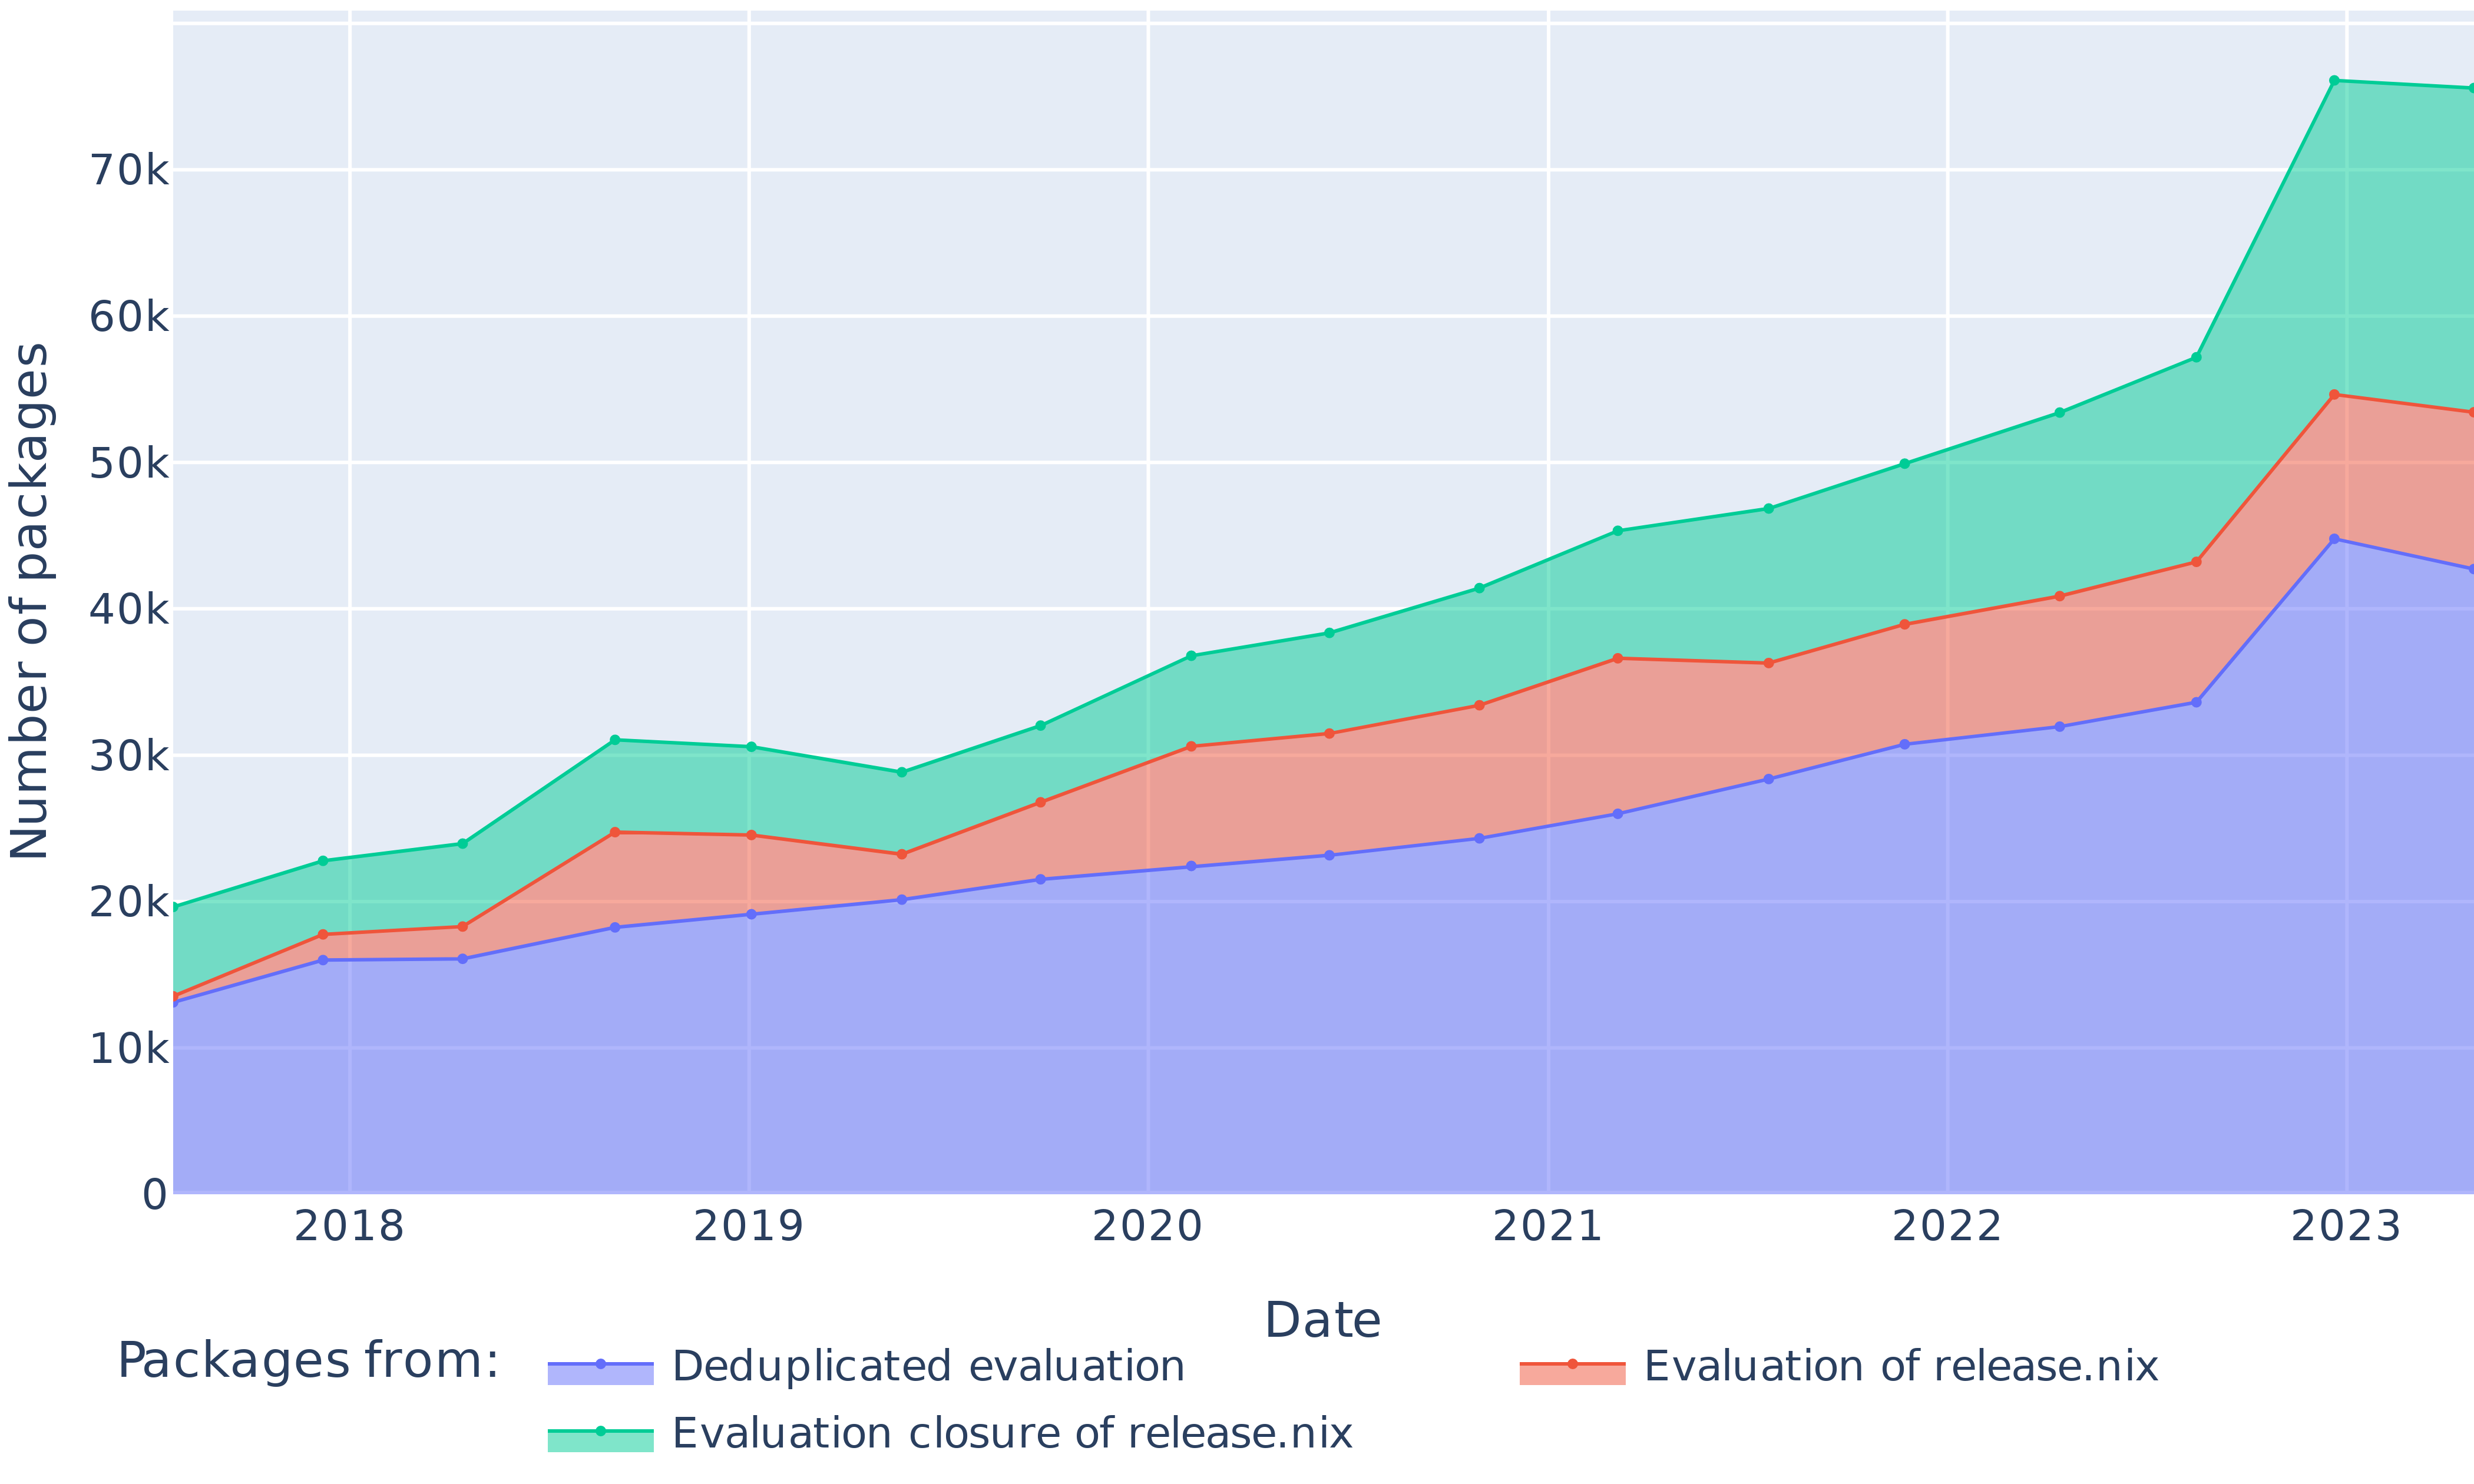
The chart visualizes the cumulative growth of three categories of packages ("Deduplicated evaluation," "Evaluation of release.nix," and "Evaluation closure of release.nix") from 2018 to 2023. The total number of packages increases steadily, with significant acceleration in 2023.
### Components/Axes
- **X-axis (Date)**: Years 2018–2023, labeled at 2-year intervals.
- **Y-axis (Number of packages)**: Ranges from 0 to 80,000, with increments of 10,000.
- **Legend**: Located at the bottom, with three color-coded categories:
- **Blue**: Deduplicated evaluation
- **Red**: Evaluation of release.nix
- **Green**: Evaluation closure of release.nix
- **Stacking**: Categories are stacked vertically, with blue at the base, red in the middle, and green on top.
### Detailed Analysis
1. **Deduplicated evaluation (Blue)**:
- Starts at ~12,000 packages in 2018.
- Gradual increase to ~42,000 by 2023.
- Consistent upward trend with minor fluctuations (e.g., slight dip in 2019).
2. **Evaluation of release.nix (Red)**:
- Begins at ~3,000 packages in 2018.
- Peaks at ~10,000 in 2021.
- Declines to ~5,000 by 2023.
- Sharp drop between 2021–2023 suggests reduced reliance or consolidation.
3. **Evaluation closure of release.nix (Green)**:
- Starts at ~5,000 packages in 2018.
- Accelerates to ~15,000 in 2021.
- Surges to ~30,000 in 2023.
- Steep rise in 2023 indicates a major shift or new release cycle.
4. **Total Packages**:
- 2018: ~20,000 (blue + red + green).
- 2023: ~75,000 (blue + red + green).
- Growth accelerates post-2021, with a 50% increase from 2022–2023.
### Key Observations
- **Dominance of Deduplicated evaluation**: Blue consistently represents the largest share (~50–60% of total packages).
- **Green surge in 2023**: The green category’s rapid growth in 2023 suggests a pivotal event (e.g., release.nix closure or major update).
- **Red category decline**: The red line’s drop after 2021 may reflect reduced evaluation activity or integration into other categories.
- **Total growth trajectory**: Packages grow from ~20k to ~75k, a 275% increase over 5 years.
### Interpretation
The data highlights a shift in evaluation practices over time. The steady growth of "Deduplicated evaluation" indicates its foundational role, while the rise of "Evaluation closure of release.nix" in 2023 suggests a strategic focus on closure processes, possibly due to a major release or architectural change. The decline in "Evaluation of release.nix" could signal consolidation, automation, or migration to newer workflows. The total package growth underscores increasing activity, likely tied to evolving software development practices or organizational scaling. The 2023 spike in green packages warrants further investigation into release.nix’s role in this period.