## Line Chart: Number of Packages Over Time
### Overview
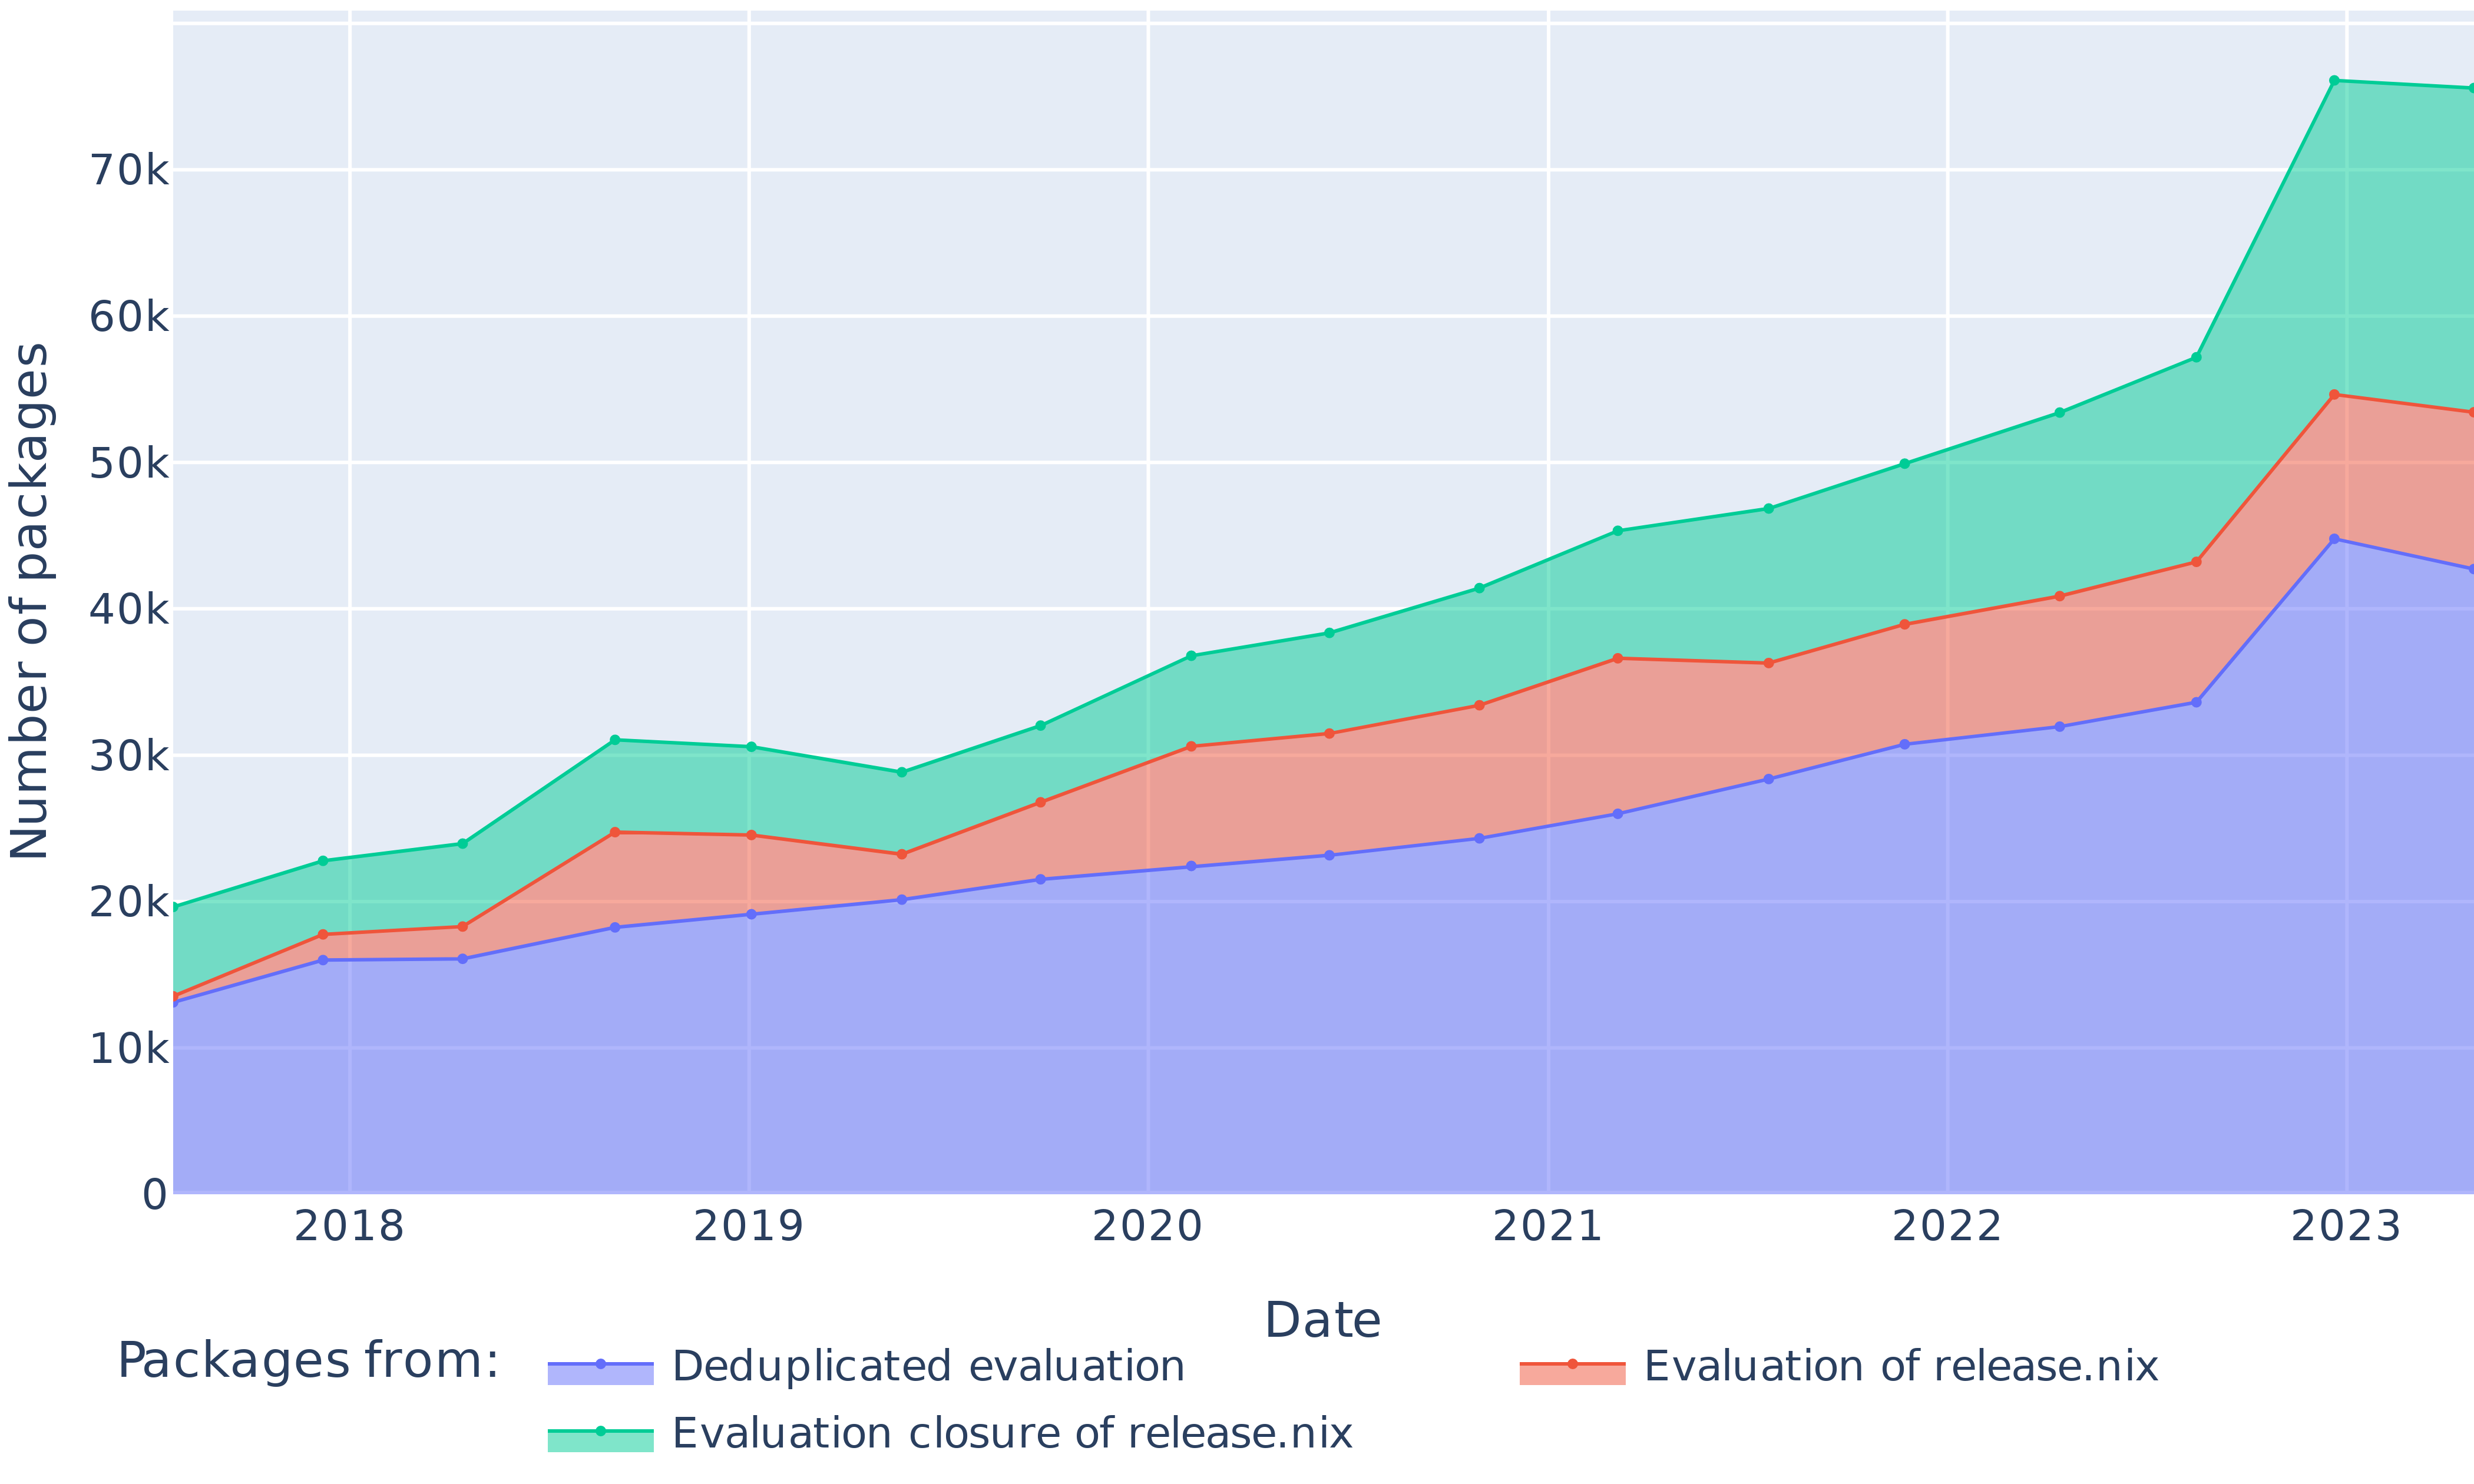
This line chart depicts the number of packages over time, from 2018 to 2023. Three different package sources are tracked: "Dedupicated evaluation", "Evaluation of release.nix", and "Evaluation closure of release.nix". The chart shows a general upward trend for all package sources, with varying rates of increase.
### Components/Axes
* **X-axis:** "Date", ranging from 2018 to 2023, with markers at each year.
* **Y-axis:** "Number of packages", ranging from 0 to 70,000, with increments of 10,000.
* **Legend:** Located at the bottom-center of the chart.
* "Dedupicated evaluation" - represented by a teal line.
* "Evaluation of release.nix" - represented by a red line.
* "Evaluation closure of release.nix" - represented by a light blue line.
### Detailed Analysis
* **Dedupicated evaluation (Teal Line):** This line starts at approximately 16,000 packages in 2018 and steadily increases to approximately 72,000 packages in 2023. The slope is relatively consistent throughout the period, with a slight acceleration in growth from 2021 to 2023.
* 2018: ~16,000
* 2019: ~24,000
* 2020: ~32,000
* 2021: ~42,000
* 2022: ~54,000
* 2023: ~72,000
* **Evaluation of release.nix (Red Line):** This line begins at approximately 14,000 packages in 2018 and increases to approximately 55,000 packages in 2023. The growth is slower than the "Dedupicated evaluation" line, with a more pronounced acceleration in growth from 2021 to 2023.
* 2018: ~14,000
* 2019: ~18,000
* 2020: ~24,000
* 2021: ~32,000
* 2022: ~42,000
* 2023: ~55,000
* **Evaluation closure of release.nix (Light Blue Line):** This line starts at approximately 20,000 packages in 2018 and increases to approximately 62,000 packages in 2023. The growth is initially faster than the other two lines, but slows down from 2020 to 2022 before accelerating again in 2023.
* 2018: ~20,000
* 2019: ~25,000
* 2020: ~34,000
* 2021: ~44,000
* 2022: ~52,000
* 2023: ~62,000
### Key Observations
* All three package sources show a consistent upward trend, indicating overall growth in the number of packages.
* "Dedupicated evaluation" consistently has the highest number of packages throughout the period.
* The growth rate appears to be accelerating for all three sources in 2023.
* "Evaluation of release.nix" starts with the lowest number of packages but experiences significant growth.
### Interpretation
The chart demonstrates a clear trend of increasing package availability over time for all three evaluation methods. The dominance of "Dedupicated evaluation" suggests it is the primary method used or the most comprehensive source of packages. The accelerating growth in 2023 across all sources could indicate increased development activity, improved tooling, or a growing user base. The differences in growth rates between the methods might reflect varying levels of effort invested in each approach or inherent differences in the types of packages they include. The fact that all lines are trending upwards suggests a healthy and expanding ecosystem. The data suggests that the package ecosystem is growing rapidly, and that all three evaluation methods are contributing to this growth. The acceleration in 2023 is a notable observation that warrants further investigation to understand the underlying drivers.