## Line Charts: Toolformer Performance Across Benchmarks
### Overview
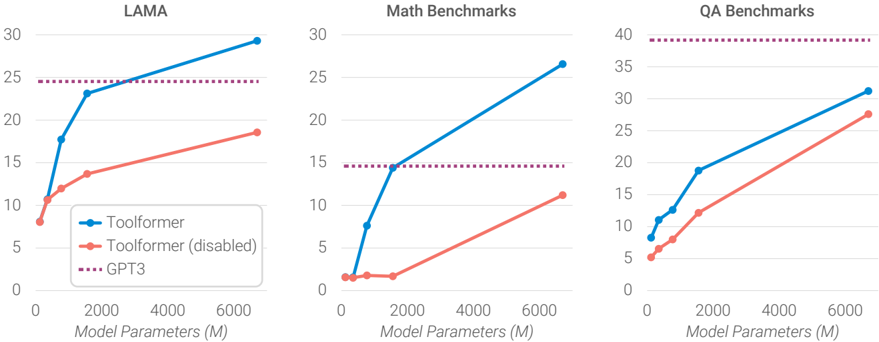
The image displays three horizontally arranged line charts comparing the performance of three AI models—Toolformer, Toolformer (disabled), and GPT3—across three different benchmark categories as a function of model size. The charts share a common x-axis (Model Parameters) and a similar visual style, with distinct lines representing each model.
### Components/Axes
* **Chart Titles (Top Center):**
* Left Chart: `LAMA`
* Middle Chart: `Math Benchmarks`
* Right Chart: `QA Benchmarks`
* **X-Axis (Bottom of each chart):**
* Label: `Model Parameters (M)` (where "M" likely denotes millions).
* Scale: Linear, with major tick marks at 0, 2000, 4000, and 6000.
* **Y-Axis (Left of each chart):**
* **LAMA Chart:** Scale from 0 to 30, with increments of 5.
* **Math Benchmarks Chart:** Scale from 0 to 30, with increments of 5.
* **QA Benchmarks Chart:** Scale from 0 to 40, with increments of 5.
* *Note: The y-axis label (e.g., "Accuracy" or "Score") is not explicitly stated in the image.*
* **Legend (Bottom-left corner of the LAMA chart):**
* **Blue line with circle markers:** `Toolformer`
* **Red/Salmon line with circle markers:** `Toolformer (disabled)`
* **Purple dotted line:** `GPT3`
### Detailed Analysis
**1. LAMA Chart (Left)**
* **Toolformer (Blue):** Shows a steep, concave-down increasing trend. Approximate data points: (0M, ~10), (500M, ~17), (1000M, ~23), (6000M, ~29).
* **Toolformer (disabled) (Red):** Shows a steady, roughly linear increasing trend, consistently below the Toolformer line. Approximate data points: (0M, ~8), (500M, ~11), (1000M, ~13), (6000M, ~18).
* **GPT3 (Purple Dotted):** A horizontal line at a constant value of approximately 25. It is intersected and surpassed by the Toolformer line at around 1500M parameters.
**2. Math Benchmarks Chart (Center)**
* **Toolformer (Blue):** Shows a very steep, nearly linear increase from a low starting point. Approximate data points: (0M, ~1), (500M, ~7), (1000M, ~14), (6000M, ~26).
* **Toolformer (disabled) (Red):** Shows a much shallower, linear increase. Approximate data points: (0M, ~1), (500M, ~1), (1000M, ~1), (6000M, ~11).
* **GPT3 (Purple Dotted):** A horizontal line at a constant value of approximately 15. The Toolformer line surpasses it at roughly 1000M parameters.
**3. QA Benchmarks Chart (Right)**
* **Toolformer (Blue):** Shows a steady, slightly concave-down increasing trend. Approximate data points: (0M, ~8), (500M, ~12), (1000M, ~18), (6000M, ~31).
* **Toolformer (disabled) (Red):** Shows a steady, linear increasing trend, parallel to but below the Toolformer line. Approximate data points: (0M, ~5), (500M, ~7), (1000M, ~12), (6000M, ~27).
* **GPT3 (Purple Dotted):** A horizontal line at a constant value of approximately 39. Neither Toolformer variant reaches this performance level within the plotted parameter range.
### Key Observations
1. **Scaling Advantage:** For both Toolformer variants, performance improves with increased model parameters across all three benchmarks.
2. **Tool Use Benefit:** The standard Toolformer (blue) consistently and significantly outperforms the Toolformer (disabled) (red) at every model size and on every benchmark. The performance gap widens as model size increases, especially in the Math and LAMA benchmarks.
3. **GPT3 Baseline:** GPT3's performance is represented as a static horizontal line, suggesting it is a fixed reference point (likely its performance at a specific, large model size not on this scale).
4. **Benchmark-Specific Performance:**
* **LAMA & Math:** Toolformer surpasses the GPT3 baseline at relatively small model sizes (~1000M-1500M parameters).
* **QA:** GPT3 maintains a substantial lead over both Toolformer variants up to 6000M parameters.
* **Math:** The "disabled" variant shows minimal improvement until the largest model size, indicating tool use is particularly critical for mathematical reasoning.
### Interpretation
These charts demonstrate the efficacy of the Toolformer approach, which integrates the use of external tools (like calculators or APIs) into language model inference. The data suggests:
* **Tool Use is a Force Multiplier:** The consistent superiority of Toolformer over its "disabled" counterpart indicates that the ability to invoke tools provides a fundamental performance boost that scales with model size. This is not merely a function of model capacity but of architectural capability.
* **Task-Dependent Value:** The value of tool use varies by task. It provides a decisive advantage in tasks requiring precise calculation (Math) or specific knowledge lookup (LAMA), allowing smaller models to match or beat a large baseline like GPT3. For complex question answering (QA), which may rely more on deep semantic understanding and reasoning, the tool-use advantage is present but insufficient to close the gap with GPT3 within the tested parameter range.
* **Efficiency Implication:** The trends imply that for certain tasks, a smaller Toolformer model can achieve the performance of a much larger traditional model (like GPT3), potentially offering significant savings in computational resources for training and deployment. The charts argue for the development of models that learn *how* to use tools, rather than solely scaling parameters.