## Line Graphs: Performance Comparison Across Model Sizes
### Overview
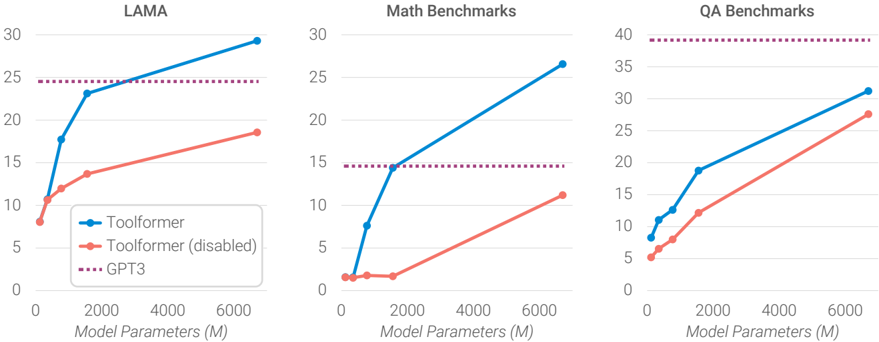
The image contains three line graphs comparing the performance of three models (Toolformer, Toolformer (disabled), and GPT3) across different benchmarks (LAMA, Math, QA) as model parameters increase from 0 to 6,000 million. Each graph shows performance metrics on the y-axis against model size on the x-axis.
### Components/Axes
- **X-axis**: Model Parameters (M) with markers at 0, 2,000, 4,000, and 6,000 million.
- **Y-axis**: Performance metric (unspecified, likely accuracy or task-specific score) with values ranging from 0 to 40.
- **Legends**: Located in the bottom-left corner of each graph, with three entries:
- **Blue line**: Toolformer (solid)
- **Orange line**: Toolformer (disabled)
- **Purple dashed line**: GPT3
- **Graph Titles**:
- Top-left: "LAMA"
- Top-center: "Math Benchmarks"
- Top-right: "QA Benchmarks"
### Detailed Analysis
#### LAMA Graph
- **Toolformer (blue)**:
- Starts at ~8M parameters with a y-value of ~10.
- Increases sharply to ~23 at 2,000M parameters.
- Reaches ~29 at 6,000M parameters.
- **Toolformer (disabled) (orange)**:
- Starts at ~8M parameters with a y-value of ~8.
- Gradually increases to ~18 at 2,000M parameters.
- Reaches ~19 at 6,000M parameters.
- **GPT3 (purple dashed)**:
- Flat line at ~25 across all parameter sizes.
#### Math Benchmarks Graph
- **Toolformer (blue)**:
- Starts at ~8M parameters with a y-value of ~1.
- Sharp increase to ~15 at 2,000M parameters.
- Reaches ~27 at 6,000M parameters.
- **Toolformer (disabled) (orange)**:
- Starts at ~8M parameters with a y-value of ~1.
- Gradual increase to ~12 at 2,000M parameters.
- Reaches ~11 at 6,000M parameters.
- **GPT3 (purple dashed)**:
- Flat line at ~15 across all parameter sizes.
#### QA Benchmarks Graph
- **Toolformer (blue)**:
- Starts at ~8M parameters with a y-value of ~8.
- Increases to ~18 at 2,000M parameters.
- Reaches ~30 at 6,000M parameters.
- **Toolformer (disabled) (orange)**:
- Starts at ~8M parameters with a y-value of ~5.
- Gradual increase to ~12 at 2,000M parameters.
- Reaches ~22 at 6,000M parameters.
- **GPT3 (purple dashed)**:
- Flat line at ~40 across all parameter sizes.
### Key Observations
1. **Toolformer (enabled)** consistently outperforms both Toolformer (disabled) and GPT3 in all benchmarks as model size increases.
2. **Toolformer (disabled)** shows improvement with larger models but lags behind the enabled version.
3. **GPT3** remains static (flat line) across all parameter sizes, suggesting it is a fixed benchmark rather than a scalable model.
4. **Performance Gaps**: The enabled Toolformer achieves ~10–20% higher scores than the disabled version in LAMA and QA, while the Math benchmark gap is narrower (~5%).
### Interpretation
The data demonstrates that enabling Toolformer significantly enhances performance across all benchmarks, with gains becoming more pronounced as model size increases. The disabled version retains some scalability but is less effective. GPT3’s flat line implies it serves as a static reference point rather than a dynamic model. These trends suggest that architectural improvements (e.g., enabling Toolformer) are critical for leveraging larger model sizes effectively.