## Conceptual Diagram: Knowledge Processing, Usage, and Memory Formats
### Overview
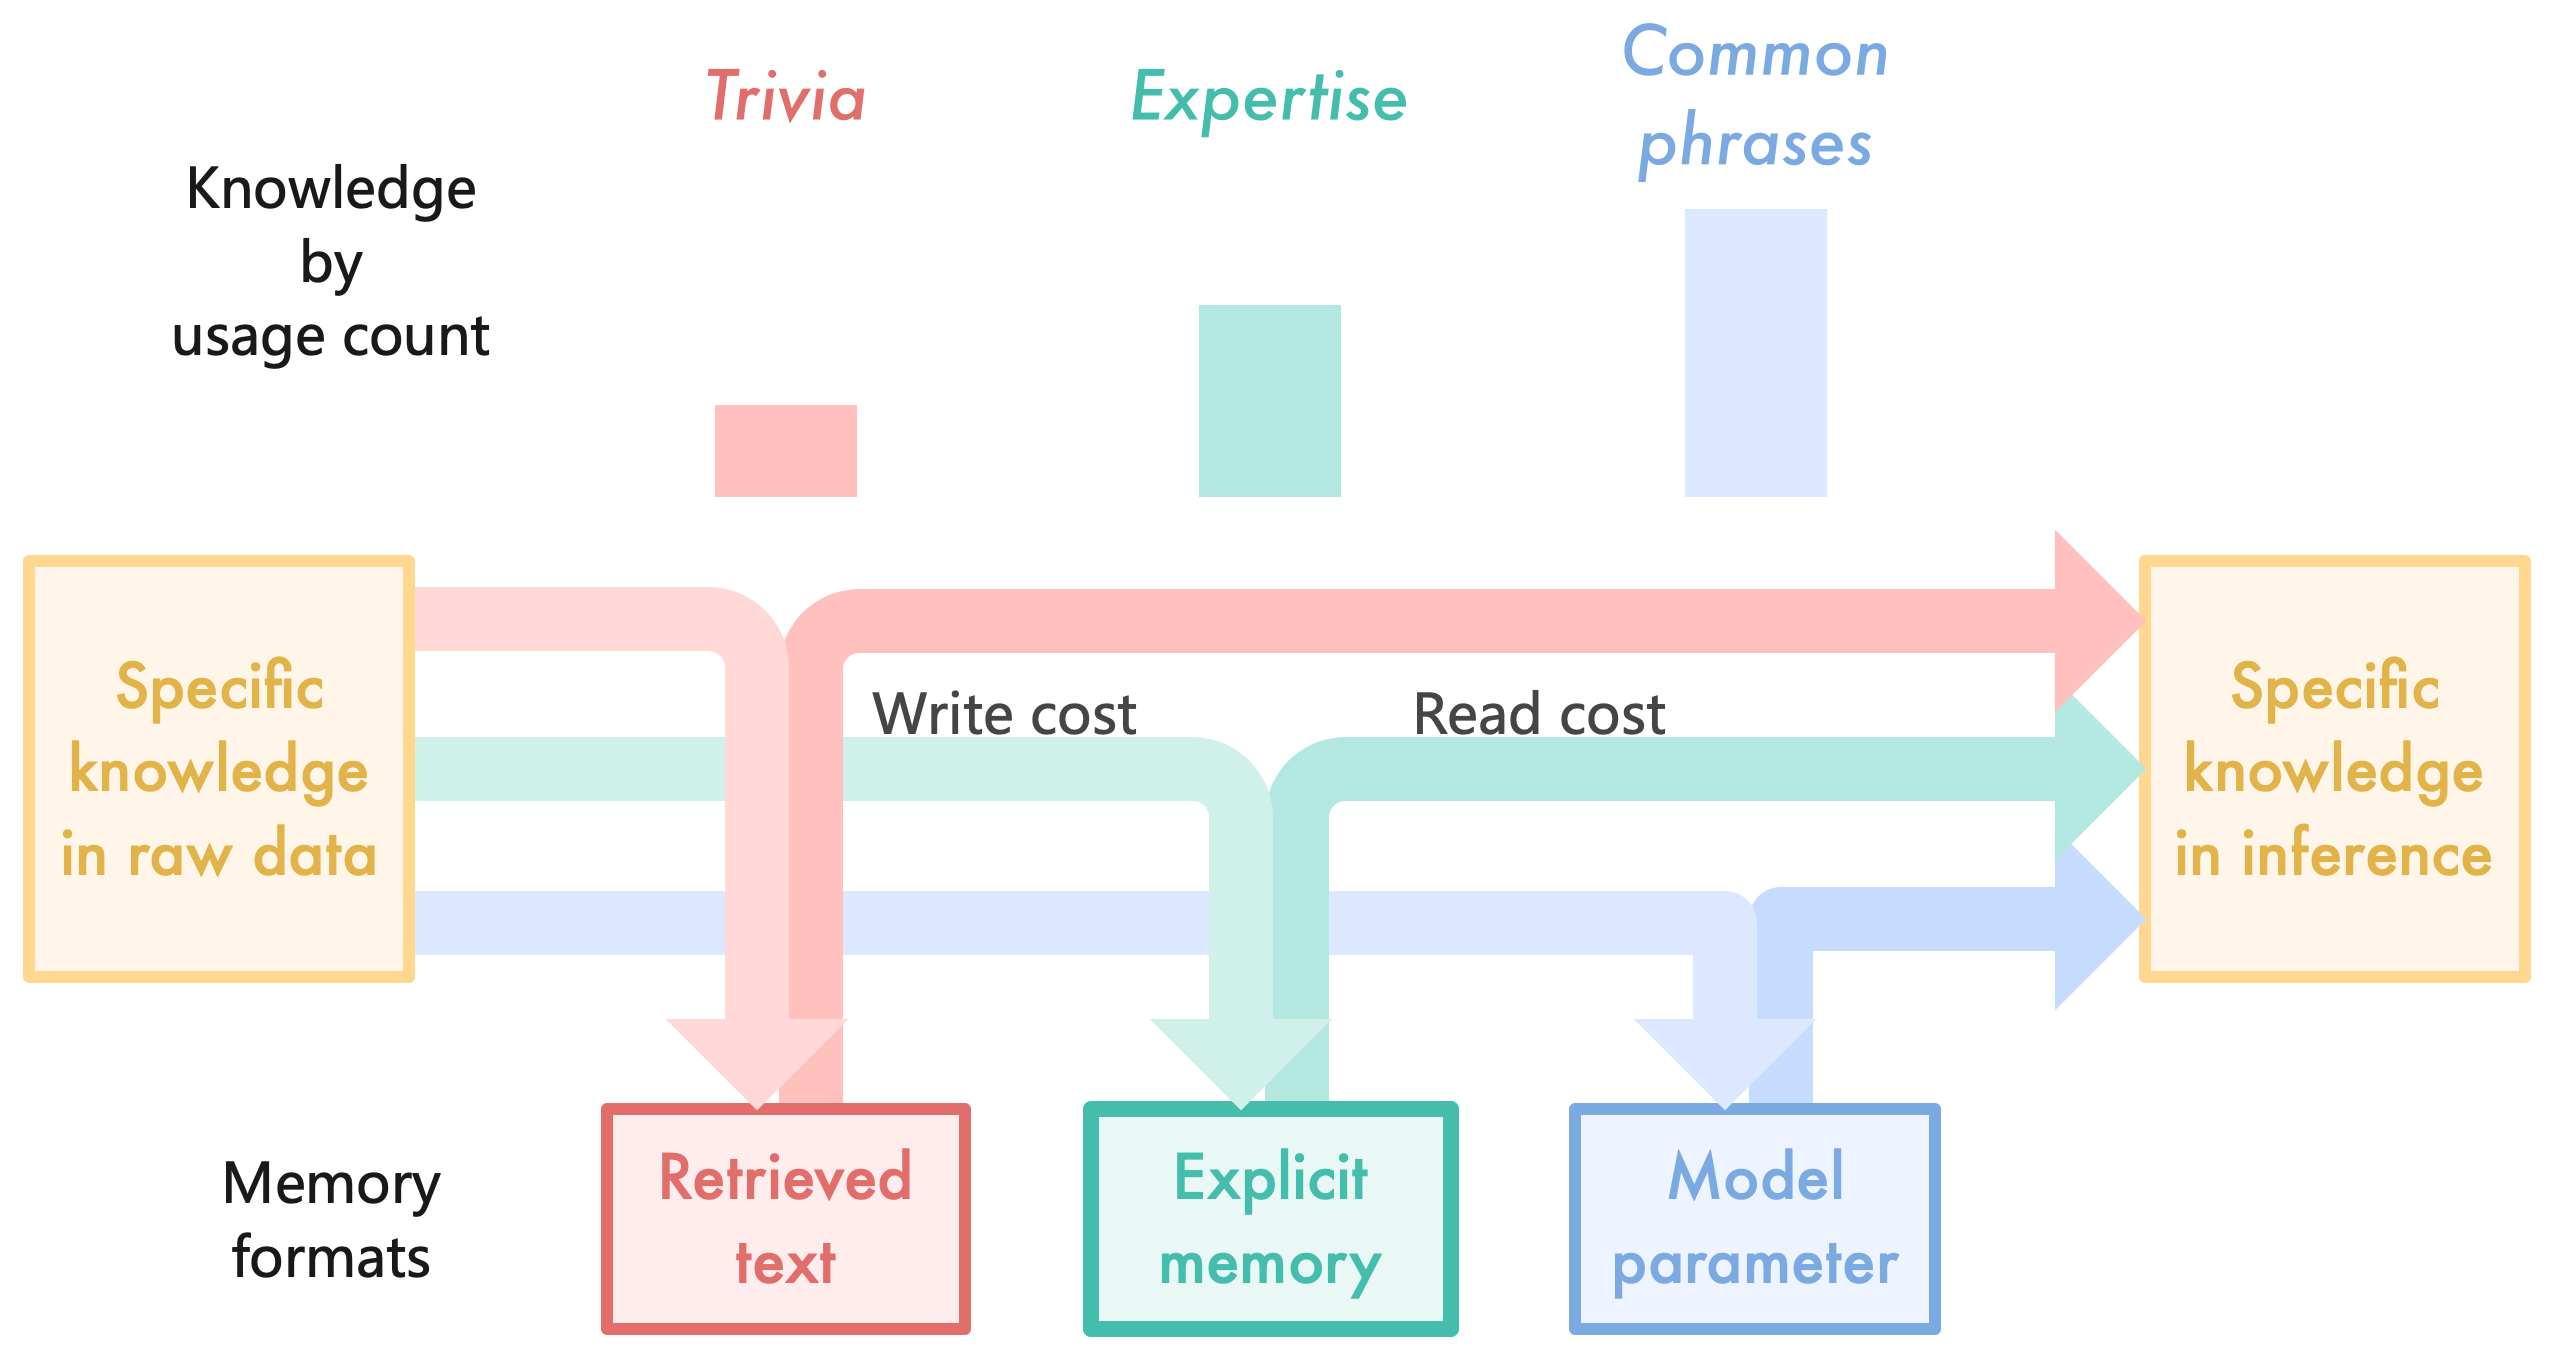
This image is a conceptual flow diagram combined with a qualitative bar chart. It illustrates how different categories of knowledge transition from raw data to inference within a system (likely a Large Language Model or AI architecture). It correlates the frequency of knowledge usage with the preferred memory format for storing that knowledge, highlighting the trade-offs between "Write cost" and "Read cost."
### Components/Axes
**1. Top Section (Bar Chart):**
* **Y-Axis Label (Implied):** "Knowledge by usage count" (Located top-left).
* **X-Axis Categories & Color Legend:**
* **Red/Pink:** "Trivia"
* **Green/Teal:** "Expertise"
* **Blue:** "Common phrases"
**2. Middle Section (Flow Diagram):**
* **Source Node (Left):** A yellow-outlined box containing the text: "Specific knowledge in raw data".
* **Destination Node (Right):** A yellow-outlined box containing the text: "Specific knowledge in inference".
* **Flow Lines:** Three colored pathways (Red, Green, Blue) connecting the source to the destination, with branches routing downward and upward.
* **Process Labels:**
* "Write cost" (Positioned above the downward-pointing arrows).
* "Read cost" (Positioned above the upward-pointing arrows).
**3. Bottom Section (Memory Formats):**
* **Category Label:** "Memory formats" (Located bottom-left).
* **Storage Nodes:**
* **Red/Pink Box:** "Retrieved text"
* **Green/Teal Box:** "Explicit memory"
* **Blue Box:** "Model parameter"
### Detailed Analysis
**Component 1: Knowledge by Usage Count (Top Chart)**
* **Visual Trend:** The bars increase in height from left to right.
* **Data Points (Approximate relative heights):**
* **Trivia (Red):** Lowest usage count (approx. 1 unit high).
* **Expertise (Green):** Medium usage count (approx. 3 units high).
* **Common phrases (Blue):** Highest usage count (approx. 5.5 units high).
**Component 2 & 3: Flow Routing and Memory Formats (Middle & Bottom)**
* **Visual Trend:** The diagram uses the *thickness* of the flow lines to indicate the dominant pathway for each knowledge type. All three colors start at "Specific knowledge in raw data" and end at "Specific knowledge in inference," but their routing through the memory formats differs significantly based on line weight.
* **Red Pathway (Trivia):**
* *Horizontal (Direct) Path:* Very thin line.
* *Memory Loop:* A thick arrow flows down (Write cost) into "Retrieved text", and a thick arrow flows up (Read cost) from "Retrieved text" to join the path to inference.
* *Extraction:* Trivia relies heavily on the "Retrieved text" memory format rather than a direct/internalized path.
* **Green Pathway (Expertise):**
* *Horizontal (Direct) Path:* Medium thickness line.
* *Memory Loop:* A medium thickness arrow flows down (Write cost) into "Explicit memory", and a medium thickness arrow flows up (Read cost) from "Explicit memory" to inference.
* *Extraction:* Expertise utilizes a balanced approach, splitting the flow evenly between direct pathways and "Explicit memory."
* **Blue Pathway (Common phrases):**
* *Horizontal (Direct) Path:* Very thick line.
* *Memory Loop:* A thin arrow flows down (Write cost) into "Model parameter", and a thin arrow flows up (Read cost) from "Model parameter" to inference.
* *Extraction:* Common phrases rely almost entirely on the direct horizontal pathway, with minimal active routing through the "Model parameter" loop during the inference phase (implying the knowledge is already baked into the direct path).
### Key Observations
1. **Inverse Relationship:** There is an inverse relationship between "Usage count" and reliance on externalized memory formats (like "Retrieved text"). The lowest usage item (Trivia) has the thickest routing through its respective memory box.
2. **Direct Relationship:** There is a direct relationship between "Usage count" and the thickness of the direct horizontal flow. The highest usage item (Common phrases) has the thickest direct line to inference.
3. **Cost Association:** The downward arrows represent the "Write cost" (storing the data), and the upward arrows represent the "Read cost" (accessing the data for inference).
### Interpretation
This diagram illustrates the architectural trade-offs in Large Language Models (LLMs) regarding how different types of information should be stored and accessed, specifically comparing Parametric Memory (internal model weights) with Non-Parametric Memory (external databases, like in Retrieval-Augmented Generation or RAG).
* **Trivia (Low Usage):** Because trivia is rarely asked for, it is inefficient to spend high computational "Write cost" to train it directly into the model's core parameters. Instead, it is better stored externally as "Retrieved text." When needed, the system incurs a "Read cost" to fetch it. The thick arrows through the memory box show this is the primary mechanism for handling rare facts.
* **Common Phrases (High Usage):** Because common phrases are used constantly, they must be available instantly. Therefore, the system pays the high "Write cost" upfront during training to embed them directly into the "Model parameter." During inference, the flow bypasses the active read/write loop (thin arrows) and flows directly to inference (thick horizontal arrow), representing zero-latency recall from the model's internal weights.
* **Expertise (Medium Usage):** This represents domain-specific knowledge that is used moderately. It utilizes a hybrid approach ("Explicit memory"), balancing the costs of training it into the model versus retrieving it on the fly.
In essence, the diagram argues that AI systems should not memorize everything equally. High-frequency data should be internalized (parameters), while low-frequency data should be externalized (retrieval), optimizing the balance between training costs (write) and inference latency (read).