\n
## Diagram: Knowledge Flow and Cost Analysis
### Overview
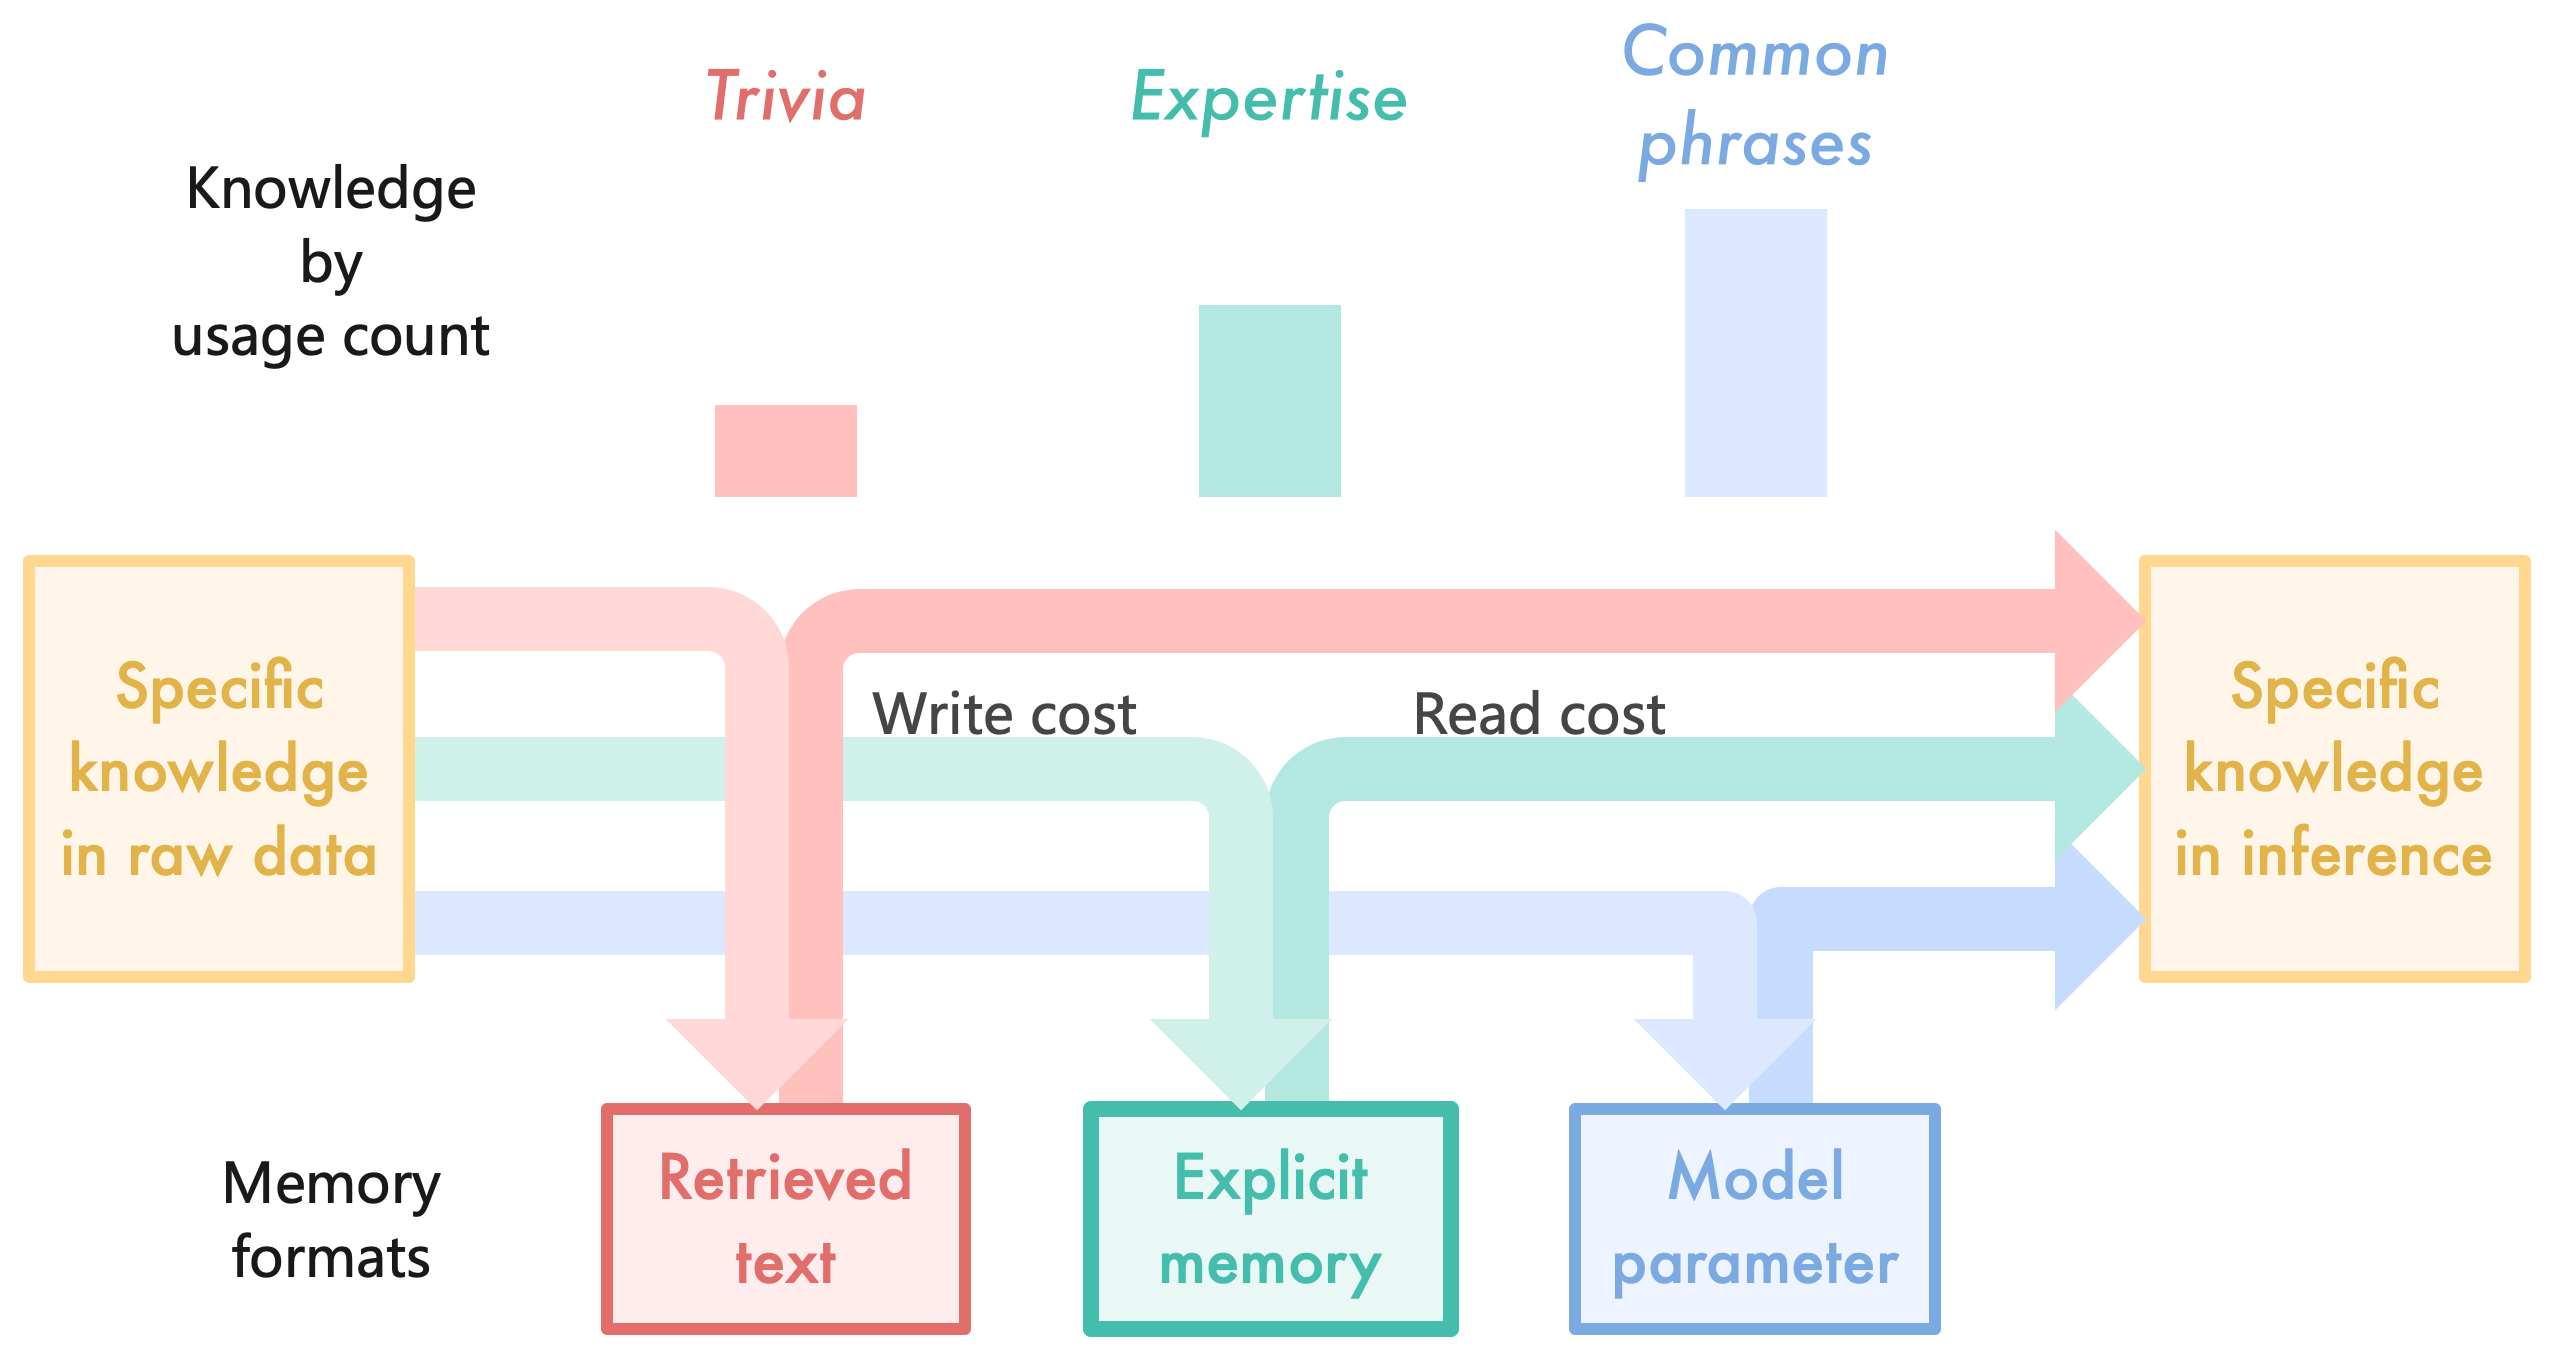
The image is a diagram illustrating the flow of knowledge from different sources (Trivia, Expertise, Common phrases) to specific knowledge in raw data and inference, along with associated costs (Write cost, Read cost). The diagram uses colored arrows to represent the flow and rectangular boxes to represent knowledge types and costs.
### Components/Axes
The diagram consists of the following components:
* **Knowledge Sources (Top):**
* Trivia (represented by a pink rectangle)
* Expertise (represented by a teal rectangle)
* Common phrases (represented by a blue rectangle)
* **Intermediate Stages (Center):**
* Write cost (represented by a pink rectangle)
* Read cost (represented by a teal rectangle)
* **Knowledge Destinations (Sides):**
* Specific knowledge in raw data (represented by a yellow rectangle on the left)
* Specific knowledge in inference (represented by a green rectangle on the right)
* **Memory Formats (Bottom-Left):**
* Memory formats (represented by a yellow rectangle)
* **Data Storage (Bottom):**
* Retrieved text (represented by a pink rectangle)
* Explicit memory (represented by a teal rectangle)
* Model parameter (represented by a blue rectangle)
* **Arrows:** Colored arrows indicate the flow of knowledge, with colors corresponding to the knowledge sources.
### Detailed Analysis or Content Details
The diagram shows the following knowledge flows:
* **Trivia (Pink):** Flows from Trivia to Write cost, then to Specific knowledge in raw data, and finally to Retrieved text.
* **Expertise (Teal):** Flows from Expertise to Read cost, then to Specific knowledge in raw data, and finally to Explicit memory.
* **Common phrases (Blue):** Flows from Common phrases to Read cost, then to Specific knowledge in inference, and finally to Model parameter.
* **Specific knowledge in raw data (Yellow):** Receives input from Trivia (via Write cost) and Expertise (via Read cost). It also connects to Memory formats.
* **Specific knowledge in inference (Green):** Receives input from Common phrases (via Read cost).
* **Memory formats (Yellow):** Connects to Specific knowledge in raw data.
The diagram does not contain numerical data, but visually represents the relative strength or frequency of knowledge flow through the thickness of the arrows. All arrows appear to be of equal thickness, suggesting equal flow.
### Key Observations
* The diagram highlights a distinction between knowledge used in "raw data" versus "inference."
* "Write cost" is associated with Trivia, while "Read cost" is associated with both Expertise and Common phrases.
* The diagram suggests that Trivia is primarily used for building knowledge in raw data, while Expertise and Common phrases contribute to knowledge used in inference.
* The diagram does not provide any quantitative information about the costs or the amount of knowledge flowing.
### Interpretation
The diagram illustrates a model of knowledge acquisition and utilization. It suggests that different types of knowledge (Trivia, Expertise, Common phrases) are processed differently and contribute to different stages of a system. The "Write cost" and "Read cost" represent the computational or resource requirements for incorporating and accessing this knowledge. The separation between "raw data" and "inference" suggests a two-stage process: first, knowledge is accumulated and stored (raw data), and then it is used for reasoning or decision-making (inference).
The diagram could be interpreted as a simplified representation of a knowledge-based system, such as a large language model. Trivia might represent factual information, Expertise might represent domain-specific knowledge, and Common phrases might represent linguistic patterns. The diagram highlights the importance of managing both the acquisition and utilization of knowledge, as well as the associated costs. The lack of quantitative data suggests that the diagram is intended to convey a conceptual framework rather than precise measurements. The diagram is a high-level overview and does not delve into the specifics of how these costs are calculated or how the knowledge is represented.