## Line Graph: Accuracy vs Compute (exaFLOP)
### Overview
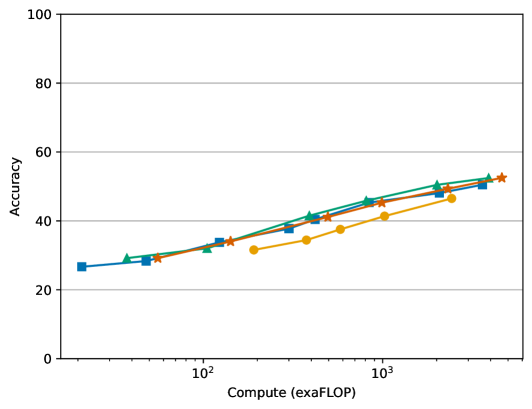
The graph illustrates the relationship between computational power (exaFLOP) and accuracy for four models (A, B, C, D). All models show an upward trend in accuracy as compute increases, with varying rates of improvement.
### Components/Axes
- **X-axis (Compute)**: Labeled "Compute (exaFLOP)" with logarithmic scale markers at 10², 10³, and 10⁴.
- **Y-axis (Accuracy)**: Labeled "Accuracy" with linear scale from 0 to 100.
- **Legend**: Located in the top-left corner, mapping colors to models:
- Blue squares: Model A
- Green triangles: Model B
- Orange circles: Model C
- Red stars: Model D
### Detailed Analysis
- **Model A (Blue Squares)**:
- 10² exaFLOP: ~25% accuracy
- 10³ exaFLOP: ~35% accuracy
- 10⁴ exaFLOP: ~45% accuracy
- 10⁵ exaFLOP: ~50% accuracy
- **Model B (Green Triangles)**:
- 10² exaFLOP: ~30% accuracy
- 10³ exaFLOP: ~40% accuracy
- 10⁴ exaFLOP: ~48% accuracy
- 10⁵ exaFLOP: ~52% accuracy
- **Model C (Orange Circles)**:
- 10² exaFLOP: ~28% accuracy
- 10³ exaFLOP: ~33% accuracy
- 10⁴ exaFLOP: ~42% accuracy
- 10⁵ exaFLOP: ~47% accuracy
- **Model D (Red Stars)**:
- 10² exaFLOP: ~32% accuracy
- 10³ exaFLOP: ~37% accuracy
- 10⁴ exaFLOP: ~45% accuracy
- 10⁵ exaFLOP: ~52% accuracy
### Key Observations
1. **Upward Trend**: All models show increased accuracy with higher compute, confirming the positive correlation between computational power and performance.
2. **Efficiency Differences**:
- Model D achieves the highest accuracy at 10⁵ exaFLOP (~52%) despite starting with lower compute than Model B.
- Model A exhibits diminishing returns after 10⁴ exaFLOP, with minimal improvement (45% → 50%).
3. **Steepest Slope**: Model D demonstrates the most rapid improvement between 10³ and 10⁴ exaFLOP (~37% → 45%).
### Interpretation
The data suggests that computational efficiency varies significantly across models. Model D outperforms others in both absolute accuracy and cost-effectiveness, achieving comparable results to Model B at lower compute levels. The plateau observed in Model A at higher compute levels implies potential architectural or algorithmic limitations. These findings highlight the importance of optimizing model design for compute efficiency rather than solely increasing hardware resources. The logarithmic x-axis emphasizes that even modest increases in compute (e.g., 10³ → 10⁴ exaFLOP) can yield disproportionate accuracy gains for certain models.