## Diagram: Variational Autoencoder (VAE) Architecture
### Overview
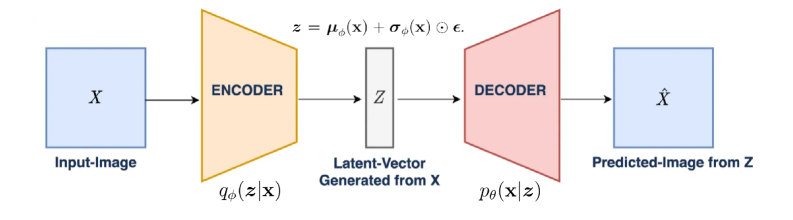
The image depicts a diagram of a Variational Autoencoder (VAE) architecture. It illustrates the flow of data from an input image through an encoder, a latent space representation, a decoder, and finally to a predicted output image.
### Components/Axes
* **Input-Image (X):** A blue square on the left, representing the input image.
* **Encoder:** An orange trapezoid labeled "ENCODER". The encoder transforms the input image into a latent representation. The function below the encoder is labeled as q<sub>φ</sub>(z|x).
* **Latent-Vector Generated from X (Z):** A gray rectangle in the center, representing the latent vector. The equation above the latent vector is z = μ<sub>φ</sub>(x) + σ<sub>φ</sub>(x) ⊙ ε.
* **Decoder:** A red trapezoid labeled "DECODER". The decoder transforms the latent vector back into an image. The function below the decoder is labeled as p<sub>θ</sub>(x|z).
* **Predicted-Image from Z (X̂):** A blue square on the right, representing the predicted output image.
### Detailed Analysis
The diagram shows the following flow:
1. An input image (X) is fed into the encoder.
2. The encoder maps the input image to a latent space, represented by the latent vector (Z). The latent vector is generated from X. The equation z = μ<sub>φ</sub>(x) + σ<sub>φ</sub>(x) ⊙ ε describes how the latent vector z is constructed from the mean μ<sub>φ</sub>(x) and standard deviation σ<sub>φ</sub>(x) of the encoder's output, combined with a random noise term ε.
3. The latent vector (Z) is then fed into the decoder.
4. The decoder reconstructs the image from the latent vector, producing a predicted image (X̂).
### Key Observations
* The diagram illustrates the core components of a VAE: encoder, latent space, and decoder.
* The encoder and decoder are represented as trapezoids, suggesting a transformation or compression/decompression process.
* The latent space is represented as a rectangle, indicating a lower-dimensional representation of the input data.
* The arrows indicate the flow of data through the network.
### Interpretation
The diagram illustrates the fundamental principle of a Variational Autoencoder (VAE). The VAE learns a probabilistic mapping from the input data to a latent space, and then learns to reconstruct the input data from this latent representation. The latent space is designed to capture the underlying structure and variability of the input data. The equation z = μ<sub>φ</sub>(x) + σ<sub>φ</sub>(x) ⊙ ε highlights the probabilistic nature of the latent space, where the latent vector z is sampled from a distribution parameterized by the encoder's output (mean μ<sub>φ</sub>(x) and standard deviation σ<sub>φ</sub>(x)) and a random noise term ε. This allows the VAE to generate new data points by sampling from the latent space and decoding them.