## Line Chart: GPQA vs RL Training Steps
### Overview
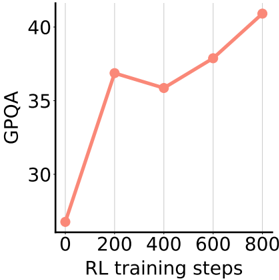
The image is a line chart showing the relationship between GPQA (General Purpose Question Answering) performance and the number of RL (Reinforcement Learning) training steps. The chart indicates an upward trend, suggesting that GPQA performance generally improves with more RL training steps.
### Components/Axes
* **X-axis:** RL training steps, with markers at 0, 200, 400, 600, and 800.
* **Y-axis:** GPQA, with markers at 30, 35, and 40.
* **Line:** A single line in a salmon color represents the GPQA performance at different RL training steps.
### Detailed Analysis
The line starts at approximately 27 GPQA at 0 RL training steps. It then rises sharply to approximately 37 GPQA at 200 RL training steps. The line then decreases slightly to approximately 36 GPQA at 400 RL training steps. The line then increases to approximately 38 GPQA at 600 RL training steps. Finally, the line increases to approximately 40 GPQA at 800 RL training steps.
* **Data Points:**
* (0, 27)
* (200, 37)
* (400, 36)
* (600, 38)
* (800, 40)
### Key Observations
* There is a significant initial increase in GPQA performance from 0 to 200 RL training steps.
* The performance plateaus and even slightly decreases between 200 and 400 steps.
* The performance continues to increase from 400 to 800 steps, but at a slower rate than the initial increase.
### Interpretation
The chart suggests that RL training positively impacts GPQA performance, especially in the early stages of training. The initial rapid increase indicates that the model quickly learns to improve its question-answering abilities with RL. The plateau and subsequent slower increase suggest diminishing returns as the model is trained further. The data implies that there is a benefit to using RL training to improve GPQA performance, but the optimal number of training steps may depend on the specific task and model architecture.