\n
## Line Chart: GPQA vs. RL Training Steps
### Overview
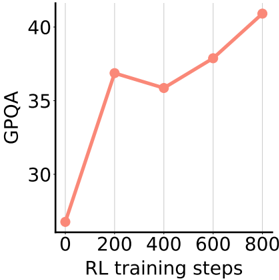
This image presents a line chart illustrating the relationship between GPQA scores and RL (Reinforcement Learning) training steps. The chart shows how the GPQA score changes as the number of RL training steps increases.
### Components/Axes
* **X-axis:** "RL training steps" ranging from 0 to 800, with gridlines at intervals of 100.
* **Y-axis:** "GPQA" ranging from 25 to 45, with gridlines at intervals of 5.
* **Data Series:** A single line representing GPQA scores over RL training steps. The line is colored a light coral (#F08080).
* **Data Points:** Marked with circular points along the line.
### Detailed Analysis
The line generally slopes upward, indicating a positive correlation between RL training steps and GPQA scores. However, there is a slight dip in the GPQA score between 200 and 400 RL training steps.
Here's a breakdown of the approximate data points:
* **0 RL training steps:** GPQA ≈ 21
* **200 RL training steps:** GPQA ≈ 38
* **400 RL training steps:** GPQA ≈ 36
* **600 RL training steps:** GPQA ≈ 39
* **800 RL training steps:** GPQA ≈ 41
The line starts at approximately 21 GPQA at 0 RL training steps. It rises sharply to around 38 GPQA at 200 steps. It then decreases slightly to around 36 GPQA at 400 steps, before increasing again to approximately 39 GPQA at 600 steps, and finally reaching around 41 GPQA at 800 steps.
### Key Observations
* The most significant increase in GPQA occurs within the first 200 RL training steps.
* There's a temporary decrease in GPQA between 200 and 400 RL training steps, suggesting a potential plateau or temporary setback in learning.
* The overall trend is positive, indicating that increasing RL training steps generally leads to improved GPQA scores.
### Interpretation
The chart suggests that reinforcement learning is effective in improving GPQA scores, but the learning process isn't perfectly linear. The initial rapid increase likely represents the model quickly learning basic patterns. The dip between 200 and 400 steps could indicate the model encountering more complex scenarios or needing to adjust its strategy. The subsequent increase suggests the model eventually overcomes these challenges and continues to improve. The data suggests that continued training beyond 800 steps might yield further improvements, but the rate of improvement may diminish. The chart demonstrates the iterative nature of reinforcement learning, where progress isn't always consistent but generally trends upward with continued training.