## Line Graph: Latent Channel Value Distribution
### Overview
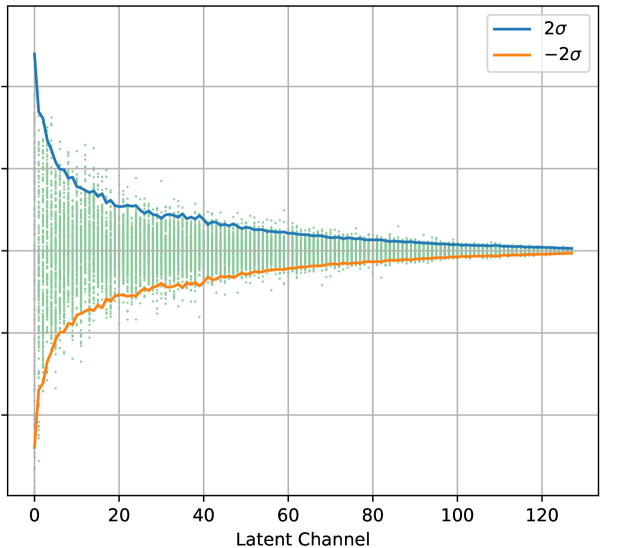
The image depicts a line graph with two primary data series (blue and orange lines) and scattered green data points. The graph illustrates how values evolve across latent channels, with confidence intervals represented by the lines and raw data points shown as green markers.
### Components/Axes
- **X-axis (Latent Channel)**: Ranges from 0 to 120 in increments of 20.
- **Y-axis (Value)**: Ranges from 0 to 140 in increments of 20.
- **Legend**:
- **Blue line**: Labeled "2σ" (positive two standard deviations).
- **Orange line**: Labeled "-2σ" (negative two standard deviations).
- **Data Points**: Green dots scattered across the graph, concentrated near the blue and orange lines.
### Detailed Analysis
1. **Blue Line (2σ)**:
- Starts at approximately **140** at x=0.
- Drops sharply to ~**100** by x=10.
- Gradually declines to ~**80** by x=20.
- Stabilizes between **70–80** from x=40 to x=120.
2. **Orange Line (-2σ)**:
- Begins at ~**60** at x=0.
- Rises to ~**80** by x=20.
- Increases to ~**90** by x=40.
- Flattens between **90–100** from x=60 to x=120.
3. **Green Data Points**:
- Clustered around the blue and orange lines, with slight dispersion.
- Most points lie within the bounds of the two lines, suggesting adherence to the ±2σ range.
### Key Observations
- The blue line (2σ) exhibits a steep initial decline followed by stabilization, while the orange line (-2σ) shows a gradual ascent before plateauing.
- Green data points align closely with the lines, indicating minimal deviation from the ±2σ thresholds.
- No significant outliers are observed; all points remain within the defined confidence intervals.
### Interpretation
The graph likely represents a statistical analysis of latent channel behavior, where:
- The **blue line (2σ)** and **orange line (-2σ)** define a confidence interval for the expected value range.
- The **green data points** confirm that observed values consistently fall within this interval, suggesting low variability or controlled conditions.
- The initial divergence between the lines (x=0–20) may indicate a transitional phase in the latent channel's behavior, stabilizing afterward.
- The flattening of both lines at higher latent channels implies convergence toward a steady state, possibly reflecting equilibrium in the system being modeled.
This visualization emphasizes the importance of confidence intervals in understanding data distribution and variability in latent space analysis.