## Chart/Diagram Type: Combined Survival Plot and Scatter Plot
### Overview
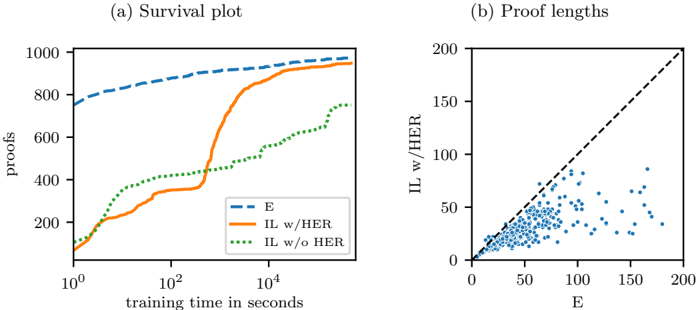
The image presents two plots side-by-side. The left plot (a) is a survival plot showing the number of proofs found over training time for three different configurations: "E", "IL w/HER", and "IL w/o HER". The right plot (b) is a scatter plot comparing the proof lengths of "E" and "IL w/HER".
### Components/Axes
**(a) Survival Plot**
* **Title:** (a) Survival plot
* **X-axis:** training time in seconds (logarithmic scale)
* Axis markers: 10<sup>0</sup>, 10<sup>2</sup>, 10<sup>4</sup>
* **Y-axis:** proofs (number of proofs)
* Axis markers: 0, 200, 400, 600, 800, 1000
* **Legend:** Located in the bottom-right corner of the plot.
* **E:** Dashed blue line
* **IL w/HER:** Solid orange line
* **IL w/o HER:** Dotted green line
**(b) Scatter Plot**
* **Title:** (b) Proof lengths
* **X-axis:** E
* Axis markers: 0, 50, 100, 150, 200
* **Y-axis:** IL w/HER
* Axis markers: 0, 50, 100, 150, 200
* **Data points:** Blue dots
* **Reference Line:** Dashed black line representing y = x
### Detailed Analysis
**(a) Survival Plot**
* **E (Dashed Blue Line):** Starts at approximately 750 proofs at 10<sup>0</sup> seconds. The number of proofs increases rapidly initially, then plateaus around 900 proofs after 10<sup>2</sup> seconds, reaching approximately 950 proofs at 10<sup>4</sup> seconds.
* **IL w/HER (Solid Orange Line):** Starts at approximately 100 proofs at 10<sup>0</sup> seconds. The number of proofs increases steadily until around 10<sup>2</sup> seconds, then increases sharply to approximately 800 proofs around 10<sup>3</sup> seconds, and then plateaus around 950 proofs at 10<sup>4</sup> seconds.
* **IL w/o HER (Dotted Green Line):** Starts at approximately 100 proofs at 10<sup>0</sup> seconds. The number of proofs increases steadily until around 10<sup>2</sup> seconds, then increases sharply to approximately 450 proofs around 10<sup>3</sup> seconds, and then plateaus around 750 proofs at 10<sup>4</sup> seconds.
**(b) Scatter Plot**
* The scatter plot shows the relationship between the proof lengths of "E" and "IL w/HER".
* Most of the data points are clustered below the dashed black line (y = x), indicating that "IL w/HER" generally produces shorter proofs than "E".
* There are some outliers where "IL w/HER" produces longer proofs than "E", but these are less frequent.
* The data points are concentrated near the origin, suggesting that many proofs are relatively short for both "E" and "IL w/HER".
### Key Observations
* In the survival plot, "E" initially finds more proofs than "IL w/HER" and "IL w/o HER", but "IL w/HER" eventually catches up and performs similarly to "E". "IL w/o HER" finds fewer proofs overall.
* The scatter plot suggests that "IL w/HER" tends to produce shorter proofs than "E".
### Interpretation
The survival plot demonstrates the learning curves of different proof search configurations. "E" appears to have a faster initial learning rate, but "IL w/HER" eventually achieves a similar performance. The "IL w/o HER" configuration is less effective in finding proofs compared to the other two.
The scatter plot provides insights into the efficiency of the proofs generated by "E" and "IL w/HER". The clustering of data points below the y = x line indicates that "IL w/HER" generally leads to shorter proofs, which could be more desirable in certain applications. The outliers suggest that there are cases where "E" can produce shorter proofs, but these are less common.