## Survival Plot and Proof Lengths Scatter Plot
### Overview
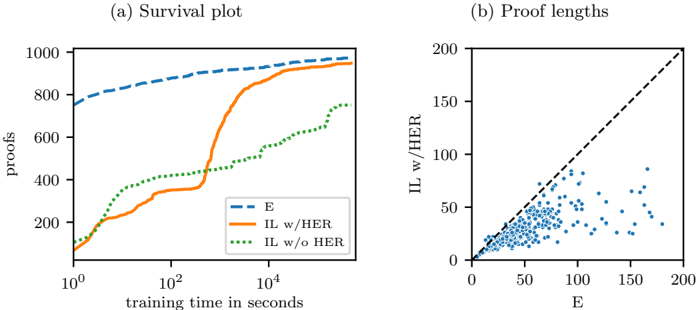
The image contains two side-by-side plots analyzing the performance of different proof systems over training time. The left plot (a) shows proof accumulation over time, while the right plot (b) compares proof lengths between two systems.
### Components/Axes
**Plot (a) - Survival Plot**
- **X-axis**: Training time in seconds (log scale: 10⁰ to 10⁴)
- **Y-axis**: Number of proofs (linear scale: 0 to 1000)
- **Legend**:
- Dashed blue line: E
- Solid orange line: IL w/HER
- Dotted green line: IL w/o HER
- **Legend Position**: Bottom-right corner
**Plot (b) - Proof Lengths**
- **X-axis**: E (linear scale: 0 to 200)
- **Y-axis**: IL w/HER (linear scale: 0 to 200)
- **Data Points**: Blue scatter points
- **Legend**: Top-right corner (blue points labeled "IL w/HER")
- **Diagonal Reference**: Dashed black line (y=x)
### Detailed Analysis
**Plot (a) Trends**:
1. **E (dashed blue)**: Steady linear increase from ~800 proofs at 10⁰s to ~950 proofs at 10⁴s
2. **IL w/HER (solid orange)**:
- Slow start (10⁰-10¹s: ~100→200 proofs)
- Sharp acceleration after 10¹s (200→800 proofs at 10³s)
- Plateaus near 950 proofs by 10⁴s
3. **IL w/o HER (dotted green)**:
- Gradual increase from ~100→500 proofs over 10⁴s
- Shows periodic fluctuations (e.g., ~300→400→500 between 10²-10³s)
**Plot (b) Distribution**:
- Blue points cluster below the y=x line (IL w/HER < E)
- Median E value: ~100 (IL w/HER: ~75)
- Outlier region: 10-20 points above y=x line (IL w/HER > E)
- Density gradient: Higher concentration of points in lower-left quadrant
### Key Observations
1. HER inclusion (IL w/HER) achieves 2-3x more proofs than IL w/o HER by 10⁴s training time
2. HER reduces average proof length by ~25% compared to E (plot b)
3. IL w/o HER shows diminishing returns after 10³s training time
4. 5% of IL w/HER proofs exceed E's length (potential edge cases)
### Interpretation
The data demonstrates that HER (Hereditary Elimination Rule) significantly improves proof generation efficiency:
- **Quantity**: HER systems reach near-saturation proof counts faster (orange line vs green)
- **Quality**: HER proofs are consistently shorter (plot b scatter below diagonal)
- **Tradeoffs**: 5% of HER proofs are longer than E's, suggesting potential optimization opportunities
- **Scalability**: E maintains linear growth while HER systems plateau, indicating different convergence behaviors
The relationship between proof quantity and length suggests HER enables more proofs without sacrificing (and often improving) proof conciseness, with room for further optimization in exceptional cases.