## Diagram: Biased Training vs. Debiased Inference in Visual Question Answering (VQA)
### Overview
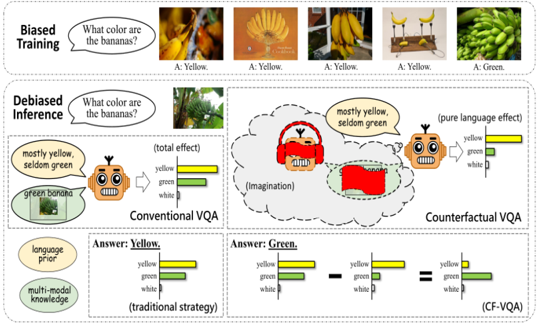
The image illustrates the concept of biased training and debiased inference in Visual Question Answering (VQA) systems. It compares how a system trained with biased data answers questions versus how a debiased system answers the same questions using conventional and counterfactual approaches. The diagram is divided into three main sections: Biased Training, Debiased Inference, and a comparison of Conventional VQA vs. Counterfactual VQA.
### Components/Axes
* **Header:** "Biased Training" and "Debiased Inference" labels the two main sections.
* **Images:** The diagram contains several images of bananas in different colors and arrangements.
* **Text Bubbles:** Speech bubbles containing questions like "What color are the bananas?" and answers like "mostly yellow, seldom green."
* **Bar Charts:** Several bar charts represent the probability or contribution of different colors (yellow, green, white) to the answer.
* **Labels:** Labels such as "language prior," "multi-modal knowledge," "(total effect)," "(pure language effect)," "(Imagination)," "(traditional strategy)," and "(CF-VQA)."
* **Robots:** Cartoon robots are used to represent the VQA system.
### Detailed Analysis
**1. Biased Training (Top Section):**
* **Question:** "What color are the bananas?"
* **Images:** Five images are shown. The first four images depict yellow bananas, and the fifth image shows green bananas.
* **Answers:** The first four images are labeled "A: Yellow." The fifth image is labeled "A: Green."
* **Trend:** The system is trained primarily on images of yellow bananas, creating a bias towards answering "yellow" to the question.
**2. Debiased Inference (Middle Section):**
* **Question:** "What color are the bananas?"
* **Image:** An image of green bananas is shown.
* **Conventional VQA:**
* A robot with a speech bubble saying "mostly yellow, seldom green" is shown.
* A bar chart labeled "(total effect)" shows the following approximate values:
* Yellow: ~60%
* Green: ~30%
* White: ~10%
* **Counterfactual VQA:**
* A robot with a speech bubble saying "mostly yellow, seldom green" is shown.
* An "(Imagination)" cloud contains a robot wearing red headphones and a red rectangle.
* A bar chart labeled "(pure language effect)" shows the following approximate values:
* Yellow: ~80%
* Green: ~15%
* White: ~5%
**3. Comparison of Conventional VQA vs. Counterfactual VQA (Bottom Section):**
* **Conventional VQA (Traditional Strategy):**
* Label: "language prior" and "multi-modal knowledge"
* Answer: "Yellow."
* Bar chart shows:
* Yellow: ~60%
* Green: ~30%
* White: ~10%
* **Counterfactual VQA (CF-VQA):**
* Answer: "Green."
* The bar chart from Conventional VQA is subtracted by an unknown amount, resulting in a new bar chart:
* Yellow: ~80% - unknown = ~0%
* Green: ~15% - unknown = ~60%
* White: ~5% - unknown = ~40%
* The final bar chart shows:
* Yellow: ~0%
* Green: ~60%
* White: ~40%
### Key Observations
* **Bias in Training:** The training data is heavily skewed towards yellow bananas, leading the system to associate the question "What color are the bananas?" with the answer "yellow."
* **Conventional VQA:** Even when presented with an image of green bananas, the conventional VQA system still leans towards "yellow" due to the bias in the training data.
* **Counterfactual VQA:** The counterfactual VQA attempts to remove the language prior and focus on the visual input, resulting in a more accurate answer of "green."
* **Color Representation:** The bar charts represent the contribution of each color to the final answer.
### Interpretation
The diagram demonstrates how biased training data can negatively impact the performance of VQA systems. Conventional VQA systems, which rely on both language priors and visual input, can be misled by these biases. Counterfactual VQA aims to mitigate this issue by isolating and removing the influence of language priors, allowing the system to focus on the visual information and provide more accurate answers. The "Imagination" cloud in the Counterfactual VQA section symbolizes the system's attempt to imagine the scenario without the biased language prior. The subtraction operation in the bottom section visually represents the removal of the language prior's influence. The goal is to make the system less reliant on pre-existing associations and more responsive to the actual content of the image.