## Dot Plot: Model Accuracy Comparison
### Overview
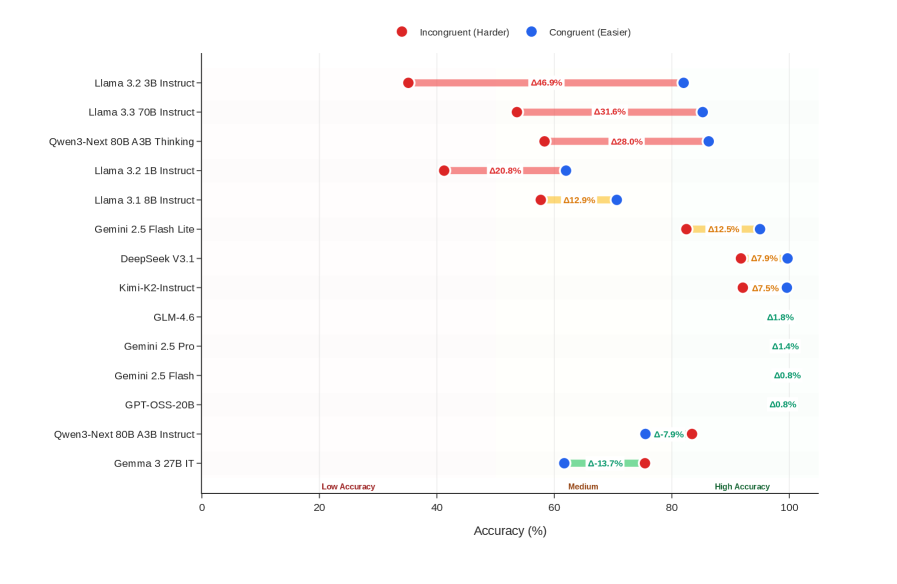
The image is a dot plot comparing the accuracy of various language models under two conditions: "Incongruent (Harder)" and "Congruent (Easier)". The plot displays the accuracy percentage for each model under each condition, with the difference between the two conditions labeled as "Δ". The models are listed on the vertical axis, and the accuracy percentage is displayed on the horizontal axis.
### Components/Axes
* **Title:** None
* **X-axis:** "Accuracy (%)" with markers at 0, 20, 40, 60, 80, and 100. Labels "Low Accuracy", "Medium", and "High Accuracy" are positioned approximately at 20, 60, and 90 respectively.
* **Y-axis:** List of language models:
* Gemma 3 27B IT
* Qwen3-Next 80B A3B Instruct-
* GPT-OSS-20B-
* Gemini 2.5 Flash -
* Gemini 2.5 Pro-
* GLM-4.6-
* Kimi-K2-Instruct-
* DeepSeek V3.1-
* Gemini 2.5 Flash Lite -
* Llama 3.1 8B Instruct-
* Llama 3.2 1B Instruct-
* Qwen3-Next 80B A3B Thinking-
* Llama 3.3 70B Instruct-
* Llama 3.2 3B Instruct-
* **Legend:** Located at the top of the chart.
* Red dot: "Incongruent (Harder)"
* Blue dot: "Congruent (Easier)"
* Yellow: Difference between Incongruent and Congruent
### Detailed Analysis or ### Content Details
Here's a breakdown of the data for each model, including the accuracy for both conditions and the difference (Δ):
* **Llama 3.2 3B Instruct-**:
* Incongruent (Harder): Approximately 40%
* Congruent (Easier): Approximately 87%
* Δ: 46.9%
* **Llama 3.3 70B Instruct-**:
* Incongruent (Harder): Approximately 50%
* Congruent (Easier): Approximately 82%
* Δ: 31.6%
* **Qwen3-Next 80B A3B Thinking-**:
* Incongruent (Harder): Approximately 50%
* Congruent (Easier): Approximately 78%
* Δ: 28.0%
* **Llama 3.2 1B Instruct-**:
* Incongruent (Harder): Approximately 55%
* Congruent (Easier): Approximately 75%
* Δ: 20.8%
* **Llama 3.1 8B Instruct-**:
* Incongruent (Harder): Approximately 65%
* Congruent (Easier): Approximately 78%
* Δ: 12.9%
* **Gemini 2.5 Flash Lite -**:
* Incongruent (Harder): Approximately 87%
* Congruent (Easier): Approximately 75%
* Δ: 12.9%
* **DeepSeek V3.1-**:
* Incongruent (Harder): Approximately 92%
* Congruent (Easier): Approximately 84%
* Δ: 7.9%
* **Kimi-K2-Instruct-**:
* Incongruent (Harder): Approximately 92.5%
* Congruent (Easier): Approximately 85%
* Δ: 7.5%
* **GLM-4.6-**:
* Incongruent (Harder): Approximately 98%
* Congruent (Easier): Approximately 96%
* Δ: 1.8%
* **Gemini 2.5 Pro-**:
* Incongruent (Harder): Approximately 98.5%
* Congruent (Easier): Approximately 97%
* Δ: 1.4%
* **Gemini 2.5 Flash -**:
* Incongruent (Harder): Approximately 99%
* Congruent (Easier): Approximately 98%
* Δ: 0.8%
* **GPT-OSS-20B-**:
* Incongruent (Harder): Approximately 99%
* Congruent (Easier): Approximately 98%
* Δ: 0.8%
* **Qwen3-Next 80B A3B Instruct-**:
* Incongruent (Harder): Approximately 82%
* Congruent (Easier): Approximately 74%
* Δ: -7.9%
* **Gemma 3 27B IT**:
* Incongruent (Harder): Approximately 62%
* Congruent (Easier): Approximately 48%
* Δ: -13.7%
### Key Observations
* The models "Llama 3.2 3B Instruct-", "Llama 3.3 70B Instruct-", "Qwen3-Next 80B A3B Thinking-", and "Llama 3.2 1B Instruct-" show a significant difference in accuracy between the "Incongruent (Harder)" and "Congruent (Easier)" conditions, with the "Congruent (Easier)" condition resulting in higher accuracy.
* The models "Qwen3-Next 80B A3B Instruct-" and "Gemma 3 27B IT" show a negative difference, indicating that they perform better in the "Incongruent (Harder)" condition.
* The models "Gemini 2.5 Flash Lite -", "DeepSeek V3.1-", "Kimi-K2-Instruct-", "GLM-4.6-", "Gemini 2.5 Pro-", "Gemini 2.5 Flash -", and "GPT-OSS-20B-" all have relatively high accuracy in both conditions, with only a small difference between them.
### Interpretation
The dot plot illustrates the performance of different language models under varying conditions of difficulty ("Incongruent" vs. "Congruent"). The large positive Δ values for some models (e.g., Llama variants) suggest that these models are more sensitive to the difficulty of the task, performing significantly better when the task is easier. Conversely, the negative Δ values for "Qwen3-Next 80B A3B Instruct-" and "Gemma 3 27B IT" indicate a potential robustness to task difficulty, or perhaps a specialization in handling more complex or "incongruent" scenarios. The models with small Δ values and high overall accuracy appear to be consistently high-performing across both conditions. This data could be used to select models based on the specific demands of the application, choosing models robust to difficulty or those that excel in easier, more "congruent" tasks.