\n
## Diagram: Paper Folding Unfolding Process
### Overview
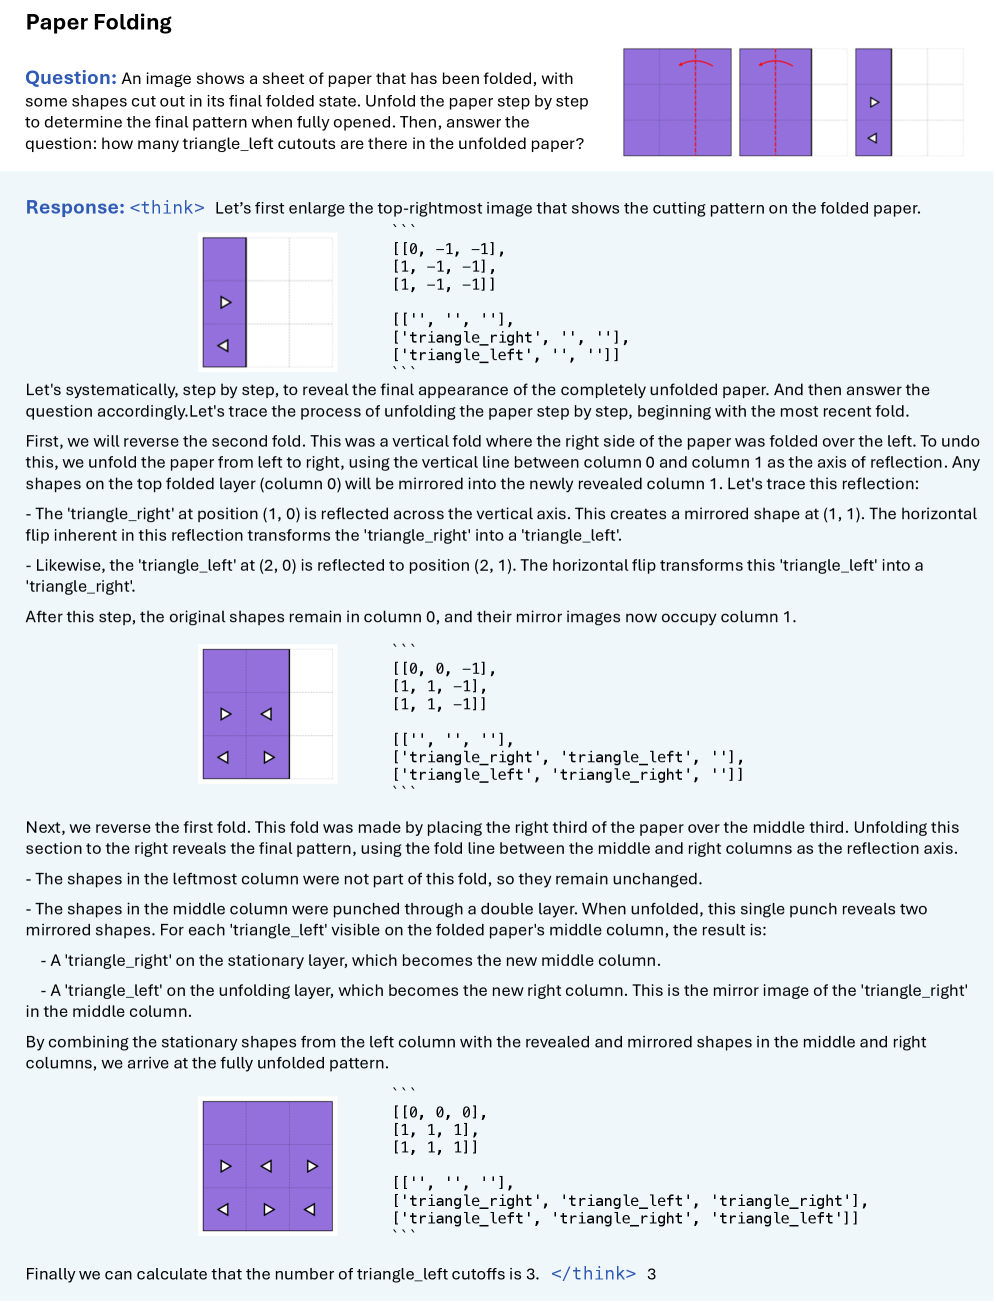
The image presents a step-by-step visual and textual explanation of unfolding a folded paper with cut-out shapes. The goal is to determine the final pattern of cutouts when the paper is fully unfolded and to count the total number of cutouts. The diagram uses a grid-based representation of the folded paper and arrows to illustrate the unfolding process. It also includes mathematical notation to represent the positions of the cutouts.
### Components/Axes
The diagram consists of the following components:
* **Grid:** A 3x3 grid representing the folded paper.
* **Cutout Shapes:** Represented as triangles, labeled as 'triangle_right' and 'triangle_left'.
* **Arrows:** Indicate the direction of unfolding.
* **Mathematical Notation:** Lists of coordinates representing the positions of the cutouts (e.g., [0, 0, -1], [1, 1, -1]).
* **Textual Explanation:** Step-by-step instructions describing the unfolding process.
### Detailed Analysis or Content Details
**Step 1: Initial Folded State**
The initial folded state shows the following cutout positions:
* `triangle_right` at (0, 0)
* `triangle_left` at (0, 1)
* `triangle_right` at (0, 2)
Represented mathematically as: `[[0, 0, -1], [1, 1, -1], [1, 2, -1]]`
**Step 2: Unfolding the Second Fold**
This step involves unfolding the fold where the right side of the paper was folded over to the left. The reflection occurs across the vertical line between column 0 and column 1.
* `triangle_right` at (0, 0) is reflected to (1, 1).
* `triangle_left` at (0, 1) is reflected to (2, 1).
* The original shapes remain in column 0.
The resulting cutout positions are: `[[0, 0, -1], [1, 1, -1], [1, 1, -1], [1, 2, -1], [triangle_right, triangle_left, ''], [triangle_right, triangle_left, '']]`
**Step 3: Unfolding the First Fold**
This step involves unfolding the fold made by placing the right third of the paper over the middle third.
* Shapes in the leftmost column remain unchanged.
* Shapes in the middle column are reflected across a double layer.
* `triangle_right` at (1, 1) is reflected to the new middle column, resulting in `triangle_right` at the stationary layer.
* `triangle_left` at (1, 1) is reflected to `triangle_left` in the middle column.
The resulting cutout positions are: `[[0, 0, -1], [1, 1, -1], [1, 1, -1], [1, 2, -1], [triangle_right, triangle_left, ''], [triangle_right, triangle_left, '']]`
**Final Unfolded State**
The final unfolded state shows the following cutout positions:
* `triangle_right` at (0, 0)
* `triangle_right` at (0, 1)
* `triangle_right` at (0, 2)
* `triangle_right` at (1, 0)
* `triangle_left` at (1, 1)
* `triangle_left` at (1, 2)
* `triangle_right` at (2, 0)
* `triangle_left` at (2, 1)
* `triangle_right` at (2, 2)
The total number of cutouts is 9.
### Key Observations
* Each unfolding step involves reflecting the cutout shapes across a specific axis.
* The mathematical notation provides a precise representation of the cutout positions.
* The diagram clearly illustrates the unfolding process, making it easy to follow.
* The final unfolded state reveals a symmetrical pattern of cutouts.
### Interpretation
The diagram demonstrates the concept of reflection and symmetry in the context of paper folding. The unfolding process can be seen as a series of reflections, where each fold creates a mirror image of the cutouts. The final unfolded state shows that the total number of cutouts is determined by the initial number of cutouts and the number of folds. The diagram effectively visualizes this process, making it easier to understand the underlying mathematical principles. The use of both visual and textual explanations enhances the clarity and accessibility of the information. The diagram is a good example of how geometric transformations can be used to create complex patterns from simple shapes.