## Chart: Average Incorrect Flips vs. Iteration
### Overview
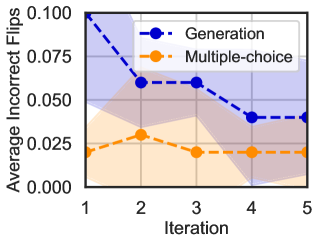
The image is a line chart comparing the average incorrect flips for two methods, "Generation" and "Multiple-choice," across five iterations. The chart shows how the average incorrect flips change with each iteration for both methods. The "Generation" method starts with a higher error rate but decreases over iterations, while the "Multiple-choice" method has a lower error rate that fluctuates slightly. Shaded regions around each line indicate the variability or uncertainty associated with each method's performance.
### Components/Axes
* **Y-axis:** "Average Incorrect Flips," ranging from 0.000 to 0.100.
* **X-axis:** "Iteration," ranging from 1 to 5.
* **Legend:** Located in the top-right corner.
* **Generation:** Represented by a blue dashed line with circular markers.
* **Multiple-choice:** Represented by an orange dashed line with circular markers.
* **Shaded Regions:** Light blue shading around the "Generation" line and light orange shading around the "Multiple-choice" line, indicating variability.
### Detailed Analysis
* **Generation (Blue Dashed Line):**
* **Trend:** Decreasing trend over iterations.
* **Data Points:**
* Iteration 1: Approximately 0.100
* Iteration 2: Approximately 0.065
* Iteration 3: Approximately 0.060
* Iteration 4: Approximately 0.040
* Iteration 5: Approximately 0.040
* **Multiple-choice (Orange Dashed Line):**
* **Trend:** Relatively stable with slight fluctuations.
* **Data Points:**
* Iteration 1: Approximately 0.020
* Iteration 2: Approximately 0.030
* Iteration 3: Approximately 0.020
* Iteration 4: Approximately 0.020
* Iteration 5: Approximately 0.025
### Key Observations
* The "Generation" method starts with a significantly higher average incorrect flips compared to the "Multiple-choice" method.
* The "Generation" method shows a noticeable decrease in average incorrect flips over the first few iterations, indicating improvement.
* The "Multiple-choice" method maintains a relatively low and stable average incorrect flips throughout all iterations.
* The shaded regions indicate that the "Generation" method has more variability in its performance, especially in the earlier iterations.
### Interpretation
The chart suggests that the "Generation" method initially performs worse than the "Multiple-choice" method in terms of average incorrect flips. However, the "Generation" method improves with more iterations, indicating a learning or optimization process. The "Multiple-choice" method, on the other hand, maintains a consistent and lower error rate, suggesting it is more stable or already optimized. The variability in the "Generation" method's performance could be due to the nature of the generation process, which might be more sensitive to initial conditions or random factors. The data demonstrates that while the generation method starts with higher error, it converges to a similar error rate as the multiple-choice method after a few iterations.