\n
## Line Chart: Incorrect Flips vs. Iteration
### Overview
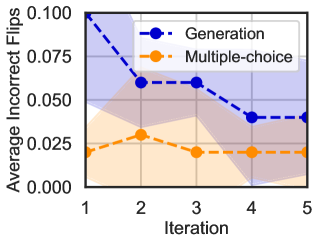
The image presents a line chart illustrating the relationship between the iteration number and the average number of incorrect flips for two different methods: "Generation" and "Multiple-choice". The chart displays a decreasing trend for both methods as the iteration number increases, suggesting improvement in performance with each iteration.
### Components/Axes
* **X-axis:** "Iteration", ranging from 1 to 5.
* **Y-axis:** "Average Incorrect Flips", ranging from 0.000 to 0.100.
* **Data Series 1:** "Generation" - Represented by a blue dashed line with circular markers.
* **Data Series 2:** "Multiple-choice" - Represented by an orange dashed line with circular markers.
* **Legend:** Located in the top-right corner, identifying the two data series and their corresponding colors.
* **Shaded Regions:** Light blue and light orange shaded regions around each line, potentially representing a confidence interval or standard deviation.
### Detailed Analysis
**Generation (Blue Line):**
The blue line starts at approximately 0.095 at Iteration 1 and exhibits a downward trend.
* Iteration 1: ~0.095
* Iteration 2: ~0.065
* Iteration 3: ~0.060
* Iteration 4: ~0.045
* Iteration 5: ~0.035
**Multiple-choice (Orange Line):**
The orange line begins at approximately 0.025 at Iteration 1 and also shows a decreasing trend, though less pronounced than the blue line.
* Iteration 1: ~0.025
* Iteration 2: ~0.040
* Iteration 3: ~0.030
* Iteration 4: ~0.020
* Iteration 5: ~0.020
The shaded regions around each line indicate variability in the data. The blue shaded region is larger, suggesting greater variability in the "Generation" method.
### Key Observations
* Both methods demonstrate a reduction in average incorrect flips as the iteration number increases.
* The "Generation" method starts with a significantly higher number of incorrect flips compared to the "Multiple-choice" method.
* The rate of decrease in incorrect flips appears to be faster for the "Generation" method in the initial iterations.
* The "Multiple-choice" method consistently maintains a lower number of incorrect flips throughout all iterations.
* The shaded regions suggest that the "Generation" method has more variance in its performance than the "Multiple-choice" method.
### Interpretation
The chart suggests that both the "Generation" and "Multiple-choice" methods improve with each iteration, as indicated by the decreasing number of incorrect flips. However, the "Multiple-choice" method consistently outperforms the "Generation" method, starting with fewer errors and maintaining a lower error rate throughout the iterations. The larger shaded region around the "Generation" line suggests that the performance of this method is more variable, potentially indicating greater sensitivity to initial conditions or other factors.
The data could be interpreted as evidence that the "Multiple-choice" approach is more robust or efficient for this particular task, while the "Generation" approach, although improving, remains less reliable. The decreasing trend for both methods implies that continued iteration could lead to further performance gains. The initial high error rate for "Generation" could be due to a more complex initial state or a more challenging learning process.