## Line Chart: Average Incorrect Flips Over Iterations
### Overview
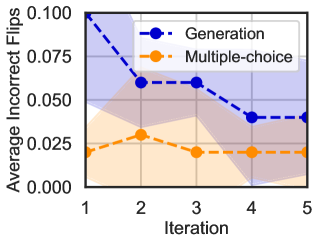
The image is a line chart comparing the performance of two methods, "Generation" and "Multiple-choice," across five iterations. The performance metric is the "Average Incorrect Flips." Each data series is represented by a dashed line with circular markers and includes a shaded region indicating a confidence interval or range of variability.
### Components/Axes
* **Chart Type:** Line chart with shaded confidence bands.
* **X-Axis (Horizontal):**
* **Label:** "Iteration"
* **Scale:** Discrete, linear scale from 1 to 5.
* **Markers:** 1, 2, 3, 4, 5.
* **Y-Axis (Vertical):**
* **Label:** "Average Incorrect Flips"
* **Scale:** Linear scale from 0.000 to 0.100.
* **Markers:** 0.000, 0.025, 0.050, 0.075, 0.100.
* **Legend:**
* **Position:** Top-right corner of the plot area.
* **Series 1:** "Generation" - Represented by a blue dashed line with blue circular markers and a light blue shaded confidence band.
* **Series 2:** "Multiple-choice" - Represented by an orange dashed line with orange circular markers and a light orange shaded confidence band.
### Detailed Analysis
**Data Series: Generation (Blue)**
* **Trend:** The line shows a steep downward trend initially, followed by a plateau.
* **Data Points (Approximate):**
* Iteration 1: ~0.100
* Iteration 2: ~0.060
* Iteration 3: ~0.060
* Iteration 4: ~0.040
* Iteration 5: ~0.040
* **Confidence Band:** The blue shaded region is widest at Iteration 1 (spanning roughly 0.050 to 0.100+), narrows significantly by Iteration 2, and remains relatively narrow through Iterations 3-5.
**Data Series: Multiple-choice (Orange)**
* **Trend:** The line shows a slight initial increase, followed by a gentle decline and stabilization.
* **Data Points (Approximate):**
* Iteration 1: ~0.020
* Iteration 2: ~0.030
* Iteration 3: ~0.020
* Iteration 4: ~0.020
* Iteration 5: ~0.020
* **Confidence Band:** The orange shaded region is moderately wide at Iteration 1 (spanning roughly 0.000 to 0.040), peaks in width at Iteration 2, and then narrows slightly but remains consistently present through Iteration 5.
### Key Observations
1. **Initial Performance Gap:** At Iteration 1, the "Generation" method has a substantially higher average of incorrect flips (~0.100) compared to the "Multiple-choice" method (~0.020).
2. **Convergence:** The performance of the two methods converges significantly over time. By Iteration 5, the values are much closer (~0.040 vs. ~0.020) than at the start.
3. **Rate of Improvement:** The "Generation" method shows a dramatic improvement (steep decline) between Iterations 1 and 2. The "Multiple-choice" method shows a much flatter trend overall.
4. **Variability:** The "Generation" method exhibits very high initial variability (wide confidence band at Iteration 1), which decreases sharply. The "Multiple-choice" method shows more consistent, moderate variability throughout.
5. **Plateau:** Both methods appear to plateau after Iteration 3 or 4, showing little to no change in the average incorrect flips for the final iterations.
### Interpretation
The chart demonstrates a comparative learning or optimization process. The "Generation" method starts with poor performance (high incorrect flips) but improves rapidly, suggesting it may be learning from its errors effectively in the early stages. The "Multiple-choice" method starts with better performance but shows less dramatic improvement, indicating it may be a more stable but less adaptable approach from the outset.
The convergence of the two lines suggests that given enough iterations (5 in this case), the performance gap between the two methods narrows considerably. The narrowing confidence band for "Generation" implies that its performance becomes more predictable and consistent as iterations progress. The data suggests that while "Multiple-choice" is initially superior, "Generation" catches up significantly, and the choice between them might depend on the cost of early errors versus the final performance ceiling. The plateau indicates that further iterations beyond 5 may yield diminishing returns for both methods under the tested conditions.