## Line Chart: Average Incorrect Flips Over Iterations
### Overview
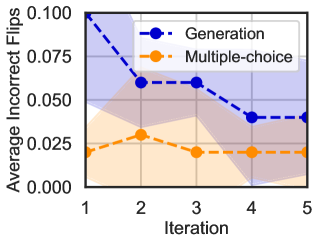
The chart illustrates the average number of incorrect flips for two methods ("Generation" and "Multiple-choice") across five iterations. The y-axis represents the average incorrect flips (0.000 to 0.100), while the x-axis shows iterations (1 to 5). Shaded regions around each line likely represent confidence intervals or variability.
### Components/Axes
- **X-axis (Iteration)**: Labeled "Iteration" with values 1, 2, 3, 4, 5.
- **Y-axis (Average Incorrect Flips)**: Labeled "Average Incorrect Flips" with values 0.000, 0.025, 0.050, 0.075, 0.100.
- **Legend**: Located in the top-right corner, with two entries:
- **Blue dashed line**: "Generation"
- **Orange dashed line**: "Multiple-choice"
- **Shaded Regions**: Light blue (Generation) and light orange (Multiple-choice) areas around each line, indicating variability.
### Detailed Analysis
- **Generation (Blue Dashed Line)**:
- **Trend**: Slopes downward from Iteration 1 to 5.
- **Data Points**:
- Iteration 1: ~0.100
- Iteration 2: ~0.060
- Iteration 3: ~0.055
- Iteration 4: ~0.040
- Iteration 5: ~0.035
- **Shaded Area**: Wider at Iteration 1, narrowing as iterations increase, suggesting decreasing variability.
- **Multiple-choice (Orange Dashed Line)**:
- **Trend**: Relatively flat with a slight dip at Iteration 2.
- **Data Points**:
- Iteration 1: ~0.020
- Iteration 2: ~0.025
- Iteration 3: ~0.020
- Iteration 4: ~0.020
- Iteration 5: ~0.020
- **Shaded Area**: Narrower and more consistent across iterations, indicating stable variability.
### Key Observations
1. **Generation** shows a clear downward trend, with average incorrect flips decreasing by ~65% from Iteration 1 to 5.
2. **Multiple-choice** remains nearly constant, with minimal fluctuation (~0.020–0.025).
3. The shaded regions for Generation are significantly larger at Iteration 1, indicating higher uncertainty early in the process.
### Interpretation
The data suggests that the "Generation" method improves over time, reducing average incorrect flips, while "Multiple-choice" maintains a stable but lower performance. The widening shaded area for Generation at Iteration 1 implies higher initial variability, which diminishes as iterations progress. This could indicate that Generation is more effective for error reduction but requires more iterations to stabilize. The consistent performance of Multiple-choice suggests it may be a reliable baseline, though less adaptive to iterative improvements.