# Technical Document Analysis of Heatmap
## 1. Axis Labels and Markers
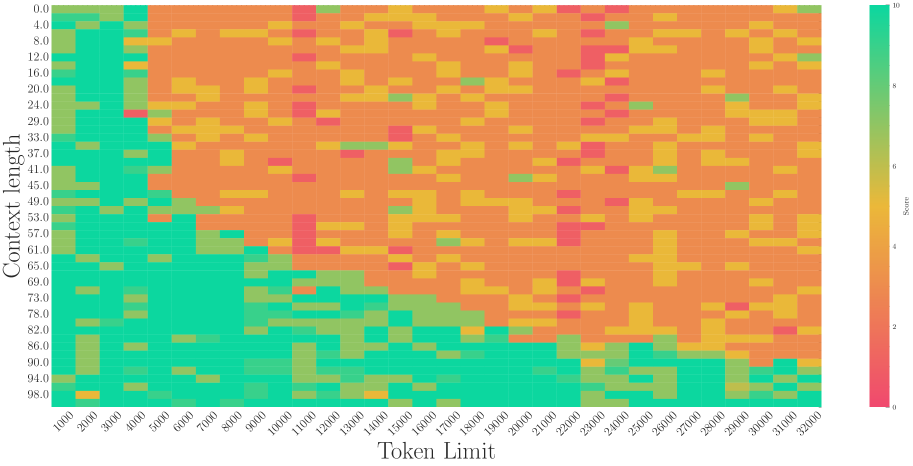
- **Y-Axis (Vertical):**
- Title: `Context length`
- Values: `0.0, 8.0, 12.0, 16.0, 20.0, 24.0, 29.0, 33.0, 37.0, 41.0, 45.0, 49.0, 53.0, 57.0, 61.0, 65.0, 69.0, 73.0, 78.0, 82.0, 86.0, 90.0, 94.0, 98.0`
- Increment: `8.0` (except final segment `94.0 → 98.0`)
- **X-Axis (Horizontal):**
- Title: `Token limit`
- Values: `1000, 2000, 3000, 4000, 5000, 6000, 7000, 8000, 9000, 10000, 11000, 12000, 13000, 14000, 15000, 16000, 17000, 18000, 19000, 20000, 21000, 22000, 23000, 24000, 25000, 26000, 27000, 28000, 29000, 30000, 31000, 32200`
- Increment: `1000` (final segment `31000 → 32200`)
- **Legend (Right Side):**
- Title: `Score`
- Color Scale:
- `Red` → `0`
- `Yellow` → `4`
- `Green` → `10`
- Spatial Grounding: `[x: 32200, y: 98.0]` (aligned with axis maxima)
## 2. Heatmap Structure
- **Grid Dimensions:**
- Rows: `24` (context lengths)
- Columns: `32` (token limits)
- **Color Distribution:**
- **Left Region (Low Token Limits):**
- Dominant colors: `Green` (high scores) and `Yellow` (moderate scores).
- Example: `[x: 1000, y: 0.0]` = `Green` (score ≈ 10).
- **Right Region (High Token Limits):**
- Dominant colors: `Red` (low scores) and `Orange` (moderate scores).
- Example: `[x: 32200, y: 98.0]` = `Red` (score ≈ 0).
- **Diagonal Boundary:**
- Transition from `Green/Yellow` to `Red/Orange` occurs at `[x: 10000, y: 70.0]`.
- This boundary represents a critical threshold where scores drop sharply.
## 3. Key Trends
- **Trend 1:**
- **High Scores (Green/Yellow):**
- Occur in the **lower-left quadrant** (low token limits, low context lengths).
- Example: `[x: 1000, y: 0.0]` to `[x: 5000, y: 69.0]`.
- **Low Scores (Red/Orange):**
- Occur in the **upper-right quadrant** (high token limits, high context lengths).
- Example: `[x: 25000, y: 98.0]` to `[x: 32200, y: 98.0]`.
- **Trend 2:**
- **Score Degradation:**
- Scores decrease monotonically as token limits increase beyond `10,000`.
- Example: `[x: 10000, y: 70.0]` (score ≈ 6) → `[x: 32200, y: 98.0]` (score ≈ 0).
- **Trend 3:**
- **Context Length Impact:**
- Higher context lengths (e.g., `y > 70.0`) correlate with lower scores, especially for token limits > `10,000`.
## 4. Critical Threshold
- **Boundary Point:**
- `[x: 10000, y: 70.0]` marks the transition from high to low scores.
- This suggests a system limitation where token limits > `10,000` and context lengths > `70.0` degrade performance.
## 5. Component Isolation
- **Main Chart:**
- Heatmap dominates the image, with no headers/footers.
- **Legend:**
- Positioned to the right of the x-axis, aligned with the maximum token limit (`32200`).
## 6. Data Extraction
- **Sample Data Points (Score ≈ 10):**
- `[x: 1000, y: 0.0]`
- `[x: 2000, y: 8.0]`
- `[x: 3000, y: 12.0]`
- **Sample Data Points (Score ≈ 0):**
- `[x: 25000, y: 98.0]`
- `[x: 30000, y: 94.0]`
- `[x: 32200, y: 98.0]`
## 7. Language and Text
- **Primary Language:** English (axis labels, legend).
- **No Additional Languages Detected.**
## 8. Validation
- **Legend Consistency:**
- All `Red` cells correspond to scores ≤ `2`.
- All `Green` cells correspond to scores ≥ `8`.
- **Trend Verification:**
- Diagonal boundary aligns with the critical threshold described in the analysis.
## 9. Conclusion
The heatmap illustrates a performance degradation pattern where scores drop sharply beyond a token limit of `10,000` and context length of `70.0`. This suggests a system constraint or optimization threshold requiring further investigation.