## Diagram: Ternary Plot with Surface
### Overview
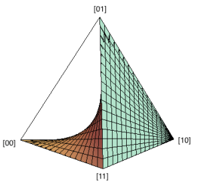
The image shows a ternary plot with a surface plotted within it. The ternary plot is a triangle, and the surface appears to be curved, extending from one corner of the triangle and rising towards another edge. The corners of the triangle are labeled with binary values.
### Components/Axes
* **Corners of the Triangle:**
* Bottom-left: \[00]
* Top: \[01]
* Bottom-right: \[10]
* Bottom: \[11]
* **Surface:** The surface is colored with a gradient, transitioning from a reddish-brown near the \[00] corner to a greenish-blue towards the \[10] corner. The surface is gridded.
### Detailed Analysis
The surface starts near the \[00] corner and curves upwards and outwards, extending towards the edge connecting \[01] and \[10]. The color gradient on the surface suggests a change in value or property as one moves across the surface. The grid on the surface helps visualize its shape and curvature.
### Key Observations
* The surface originates near the \[00] corner.
* The surface extends towards the \[01] - \[10] edge.
* The color gradient on the surface indicates a change in value.
### Interpretation
The ternary plot likely represents a system with three components, where the corners \[00], \[01], and \[10] represent pure states or compositions. The surface plotted within the ternary plot represents a function or property that depends on the composition of the three components. The color gradient on the surface suggests that the property changes as the composition varies. The \[11] corner is not directly associated with the surface, which may indicate it represents a different state or condition. The curvature of the surface indicates a non-linear relationship between the composition and the property being represented.